. 2012;7(7):e42186.
doi: 10.1371/journal.pone.0042186. Epub 2012 Jul 27.

Fluorescent in situ folding control for rapid optimization of cell-free membrane protein synthesis

Affiliations

Fluorescent in situ folding control for rapid optimization of cell-free membrane protein synthesis

Annika Müller-Lucks et al. PLoS One. 2012.

Abstract

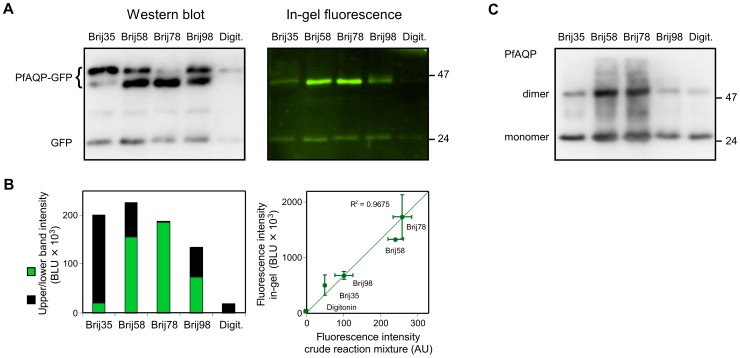
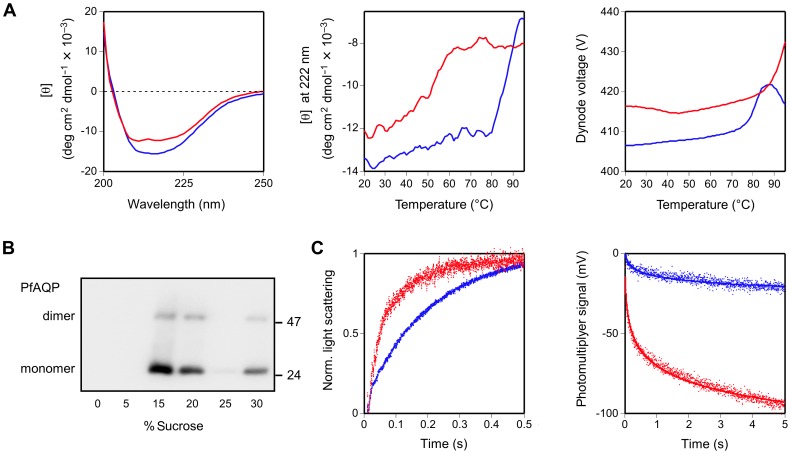
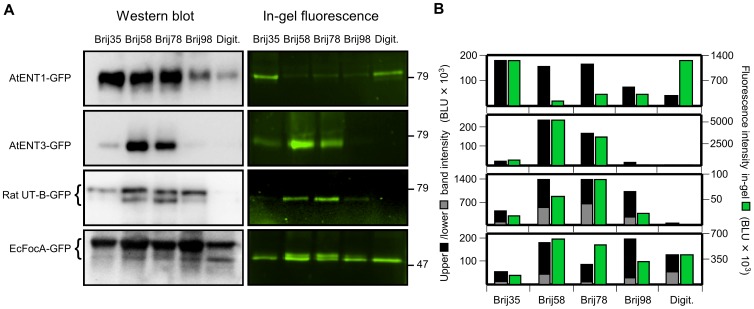
Cell-free synthesis is an open and powerful tool for high-yield protein production in small reaction volumes predestined for high-throughput structural and functional analysis. Membrane proteins require addition of detergents for solubilization, liposomes, or nanodiscs. Hence, the number of parameters to be tested is significantly higher than with soluble proteins. Optimization is commonly done with respect to protein yield, yet without knowledge of the protein folding status. This approach contains a large inherent risk of ending up with non-functional protein. We show that fluorophore formation in C-terminal fusions with green fluorescent protein (GFP) indicates the folding state of a membrane protein in situ, i.e. within the cell-free reaction mixture, as confirmed by circular dichroism (CD), proteoliposome reconstitution and functional assays. Quantification of protein yield and in-gel fluorescence intensity imply suitability of the method for membrane proteins of bacterial, protozoan, plant, and mammalian origin, representing vacuolar and plasma membrane localization, as well as intra- and extracellular positioning of the C-terminus. We conclude that GFP-fusions provide an extension to cell-free protein synthesis systems eliminating the need for experimental folding control and, thus, enabling rapid optimization towards membrane protein quality.


Conflict of interest statement

Competing Interests: The authors have declared that no competing interests exist.

Figures

Figure 1
Figure 1. Cell-free synthesis of the Plasmodium falciparum aquaglyceroporin, PfAQP, with a C-terminal GFP shows detergent-dependent signal patterns.
A. The left panel displays a Western blot of PfAQP-GFP produced in the presence of various non-ionic detergents of the Brij family and digitonin (Digit.). A polyclonal anti-GFP antiserum and a secondary horseradish peroxidase-labeled antibody were used for detection. Luminol chemiluminescence was monitored using a CCD-camera. PfAQP-GFP was obtained as two folding species with apparent molecular weights of 45 and 48 kDa. A signal representing the 24 kDa GFP domain alone was also visible. In the right panel, excitation of in-gel GFP fluorescence yielded emission signals of the 45 kDa PfAQP-GFP protein species and the 24 kDa GFP-band. B. PfAQP-GFP band intensities were determined semi-quantitatively by integration from the Western blot using arbitrary units (BLU – biomedical light units). The height of the bars in the left panel represents the total protein yield as a sum of the signals from the upper 48 kDa band (black) and the lower 45 kDa band (green). The plot in the right panel confirms correlation of the in-gel GFP fluorescence signal with GFP fluorometry of the crude cell-free reaction mixture. Intensity units given by the fluorometer are arbitrary (AU). The symbols and error bars denote mean values and the data range from two independent synthesis reactions and fluorometric evaluations. C. Cell-free synthesis, SDS-PAGE, and Western blot of non-fused PfAQP yielded signals for the monomer (≈25 kDa) and the dimer using an anti-His5 antiserum. A semi-quantitative representation of the protein yield is shown in Fig. S3. Most stable dimers were obtained with Brij58 and Brij78, which also led to highest in-gel fluorescence intensity.
Figure 2
Figure 2. Structural and functional analysis of cell-free produced PfAQP without a GFP fusion.
A. PfAQP in the presence of Brij35 (blue curve) and Brij78 (red curve) was analyzed by circular dichroism. The left panel shows the mean residue molar ellipticity [θ] in the range of 200–250 nm. Thermal unfolding was monitored at 222 nm from 20°C to 95°C (middle panel). A plot of the photomultiplyer dynode voltage versus temperature (right panel) indicates an increase in turbidity at 80°C in the sample with Brij35 solubilized PfAQP suggesting protein agglomeration. B. Reconstitution of PfAQP, produced in the prescence of Brij78, into proteoliposomes was controlled by sucrose density gradient centrifugation and Western blot using an anti-His5 antiserum. The fractions with 15% and 20% sucrose contained reconstituted liposomal PfAQP; the 30% sucrose fraction displays precipitated, non-integrated PfAQP protein. PfAQP monomers (≈25 kDa) and dimers are visible. C. For functional analysis, PfAQP-proteoliposomes (red traces) and empty control liposomes (blue traces) were subjected to an outward osmotic gradient of 300 mosm kg−1 (left panel) and an inward isotonic glycerol gradient of 300 mM (right panel). Changes in the light scattering intensity reflect liposome shrinkage due to water efflux (increase in light scattering) and liposome swelling due to glycerol plus secondary water influx (decrease in light scattering). Note the difference of the scale of the abscissae as a consequence of lower glycerol permeability by at least one order of magnitude. The slow glycerol flux across the plain lipid liposome membrane did not reach a plateau, hence, the photomultiplyer signal was plotted without normalization. For each experiment nine traces were averaged and fitted to single exponential functions.
Figure 3
Figure 3. Semi-quantification of protein yield and in-gel GFP fluorescence of representative membrane protein-GFP fusions.
A. Shown are Western blot (left panel) and in-gel fluorescence signals (right panel) of GFP fusions with Arabidopsis nucleoside transporters, AtENT1 and AtENT3, the rat urea transporter B, UT-B, and the E. coli formate transporter, EcFocA, after cell-free synthesis in the presence of various detergents of the Brij-type and digitonin (Digit.). For membrane protein characteristics see text. The molecular weight of marker proteins is indicated on the right. B. The black and gray bars represent intensities of the upper and lower band from the Western blot and the green bars those of the in-gel GFP fluorescence. The intensity units are arbitrary (BLU – biomedical light units). The differences in scale of the ordinates derive from different exposure times used in the individual experiments.

References

    1. Prasher DC, Eckenrode VK, Ward WW, Prendergast FG, Cormier MJ (1992) Primary structure of the Aequorea victoria green-fluorescent protein. Gene 111: 229–233. - PubMed
    1. Waldo GS, Standish BM, Berendzen J, Terwilliger TC (1999) Rapid protein-folding assay using green fluorescent protein. Nat Biotechnol 17: 691–695. - PubMed
    1. Drew D, Lerch M, Kunji E, Slotboom DJ, de Gier JW (2006) Optimization of membrane protein overexpression and purification using GFP fusions. Nat Methods 3: 303–313. - PubMed
    1. Newstead S, Kim H, von Heijne G, Iwata S, Drew D (2007) High-throughput fluorescent-based optimization of eukaryotic membrane protein overexpression and purification in Saccharomyces cerevisiae . Proc Natl Acad Sci U S A 104: 13936–13941. - PMC - PubMed
    1. Ashikawa Y, Ihara M, Matsuura N, Fukunaga Y, Kusakabe Y, et al. (2011) GFP-based evaluation system of recombinant expression through the secretory pathway in insect cells and its application to the extracellular domains of class C GPCRs. Protein Sci 20: 1720–1734. - PMC - PubMed

Publication types

MeSH terms