. 2012 Jul 31:13:355.
doi: 10.1186/1471-2164-13-355.

Dose-dependent effects of small-molecule antagonists on the genomic landscape of androgen receptor binding

Affiliations

Dose-dependent effects of small-molecule antagonists on the genomic landscape of androgen receptor binding

Zhou Zhu et al. BMC Genomics. .

Abstract

Background: The androgen receptor plays a critical role throughout the progression of prostate cancer and is an important drug target for this disease. While chromatin immunoprecipitation coupled with massively parallel sequencing (ChIP-Seq) is becoming an essential tool for studying transcription and chromatin modification factors, it has rarely been employed in the context of drug discovery.

Results: Here we report changes in the genome-wide AR binding landscape due to dose-dependent inhibition by drug-like small molecules using ChIP-Seq. Integration of sequence analysis, transcriptome profiling, cell viability assays and xenograft tumor growth inhibition studies enabled us to establish a direct cistrome-activity relationship for two novel potent AR antagonists. By selectively occupying the strongest binding sites, AR signaling remains active even when androgen levels are low, as is characteristic of first-line androgen ablation therapy. Coupled cistrome and transcriptome profiling upon small molecule antagonism led to the identification of a core set of AR direct effector genes that are most likely to mediate the activities of targeted agents: unbiased pathway mapping revealed that AR is a key modulator of steroid metabolism by forming a tightly controlled feedback loop with other nuclear receptor family members and this oncogenic effect can be relieved by antagonist treatment. Furthermore, we found that AR also has an extensive role in negative gene regulation, with estrogen (related) receptor likely mediating its function as a transcriptional repressor.

Conclusions: Our study provides a global and dynamic view of AR's regulatory program upon antagonism, which may serve as a molecular basis for deciphering and developing AR therapeutics.


Figures

Figure 1
Figure 1
Comparative analysis of AR binding in low and high androgen levels. (A) Mean sequence conservation profiles based on phastCons score sampled every 100 bp from the summit of AR binding sites to 10 kb in both directions. The inset provides a zoom-in view of the profiles in the immediate vicinity of the summit. (B) Over 99% of the sites bound by AR in the absence of R1881 stimuli were also bound in its presence. (C) AR selectively occupied stronger binding sites in the absence of R1881 stimuli. AR binding sites defined from R1881(+) sample were divided into two groups based on overlap with R1881(−)-defined sites (Bound: n = 2330; Not Bound: n = 14577). Boxplots depict the distributions of their binding scores.
Figure 2
Figure 2
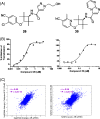
Novel AR antagonists utilized in this study. (A) Chemical structures (compound number listed below structure). (B) Nuclear Translocation of AR was impeded by these compounds. LNAR cells were treated with 0.1nM R1881 alone or in combination with the antagonist compounds at various doses to determine IC50 values. Nuclear translocation values were calculated as indicated under Methods. (C) Treatment of VCaP cells with small molecule AR antagonist induced similar genome-wide transcriptional effects as AR inhibition by siRNA. Left: fold change from the two types of treatments; Right: SAM d-score of differential expression from the two types of treatments.
Figure 3
Figure 3
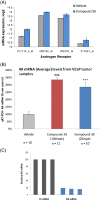
Androgen receptor level increases upon small molecule antagonism. (A) AR mRNA expression in VCaP cells (vehicle control and Compound 30, 10 μM) from four microarray probesets (The SAM q-value of differential expression are 0, 0.037, 0.043 and 0.056 respectively). The profiling experiment was performed using three independent biological replicates. (B) AR expression in tumors derived from VCaP cells implanted in CB17/lcr-Prkdc SCID mice and treated with Compounds 26 and 30 as measured by quantitative RT-PCR. n = number of animals per group; mpk = milligram per kilogram. Compound 26- and 30-treated groups were significantly different from Vehicle-group (###, *** P < 0.001). (C) AR expression in VCaP cells treated in triplicate for 48 hr with 25 nM of either control/non-targeted siRNA (Neg-siRNA, Dharmacon Cat# D-001810-10) or AR-siRNA pool (Dharmacon Cat# L-003400-00) as measured by quantitative RT-PCR. AR-siRNA treated samples were significantly different from control/non-targeted ones (P = 3.49e-5).
Figure 4
Figure 4
Effect of AR antagonist treatment on prostate cancer cell viability and tumor growth inhibition. (A) Number of live cells as a percentage of control treatment. Each data point represents the mean of at least three independent assays performed in duplicates. Bars represent standard deviation of the mean (SEM). * P < 0.05; ** P < 0.01; *** P < 0.001 (two-way ANOVA, GraphPad Prism). (B) Tumor Growth Inhibition (TGI) and PSA inhibition obtained from VCaP xenograft SCID mice treated for 3 months with Compounds 26 and 30. Tumor volume: The differences between both compound-treated groups and vehicle-treated control were statistically significant from Day 49 of treatment onward [Compound 30: *** P < 0.001 for all measurements; Compound 26: ## P < 0.01 at day 53 and ### P < 0.001 for the rest of the measurements). PSA levels: Compound 30-treated group was significantly different (*** P < 0.001) from vehicle-treated control on Days 74, 83 and 89; Compound 26-treated group was significantly different (### P < 0.001) from vehicle-treated control on Days 74, 83 and 90 (two-way ANOVA, GraphPad Prism).
Figure 5
Figure 5
AR binding upon small molecule antagonism. (A) Number of high-confidence AR binding sites in various conditions. (B) Percent (%) impact of AR antagonists with increasing dosage. To quantify the molecular effects of AR antagonists, “maximum” and “minimum” AR binding were defined using non-antagonist-treated R1881(+) and R1881(−) cistromes and the % impact was based on their differentially occupied sites. (C) AR antagonists preferentially disrupted weaker binding sites. R1881(+)-defined binding sites were sorted by descending MACS binding score (in cases of a tie, they were further sorted by descending fold enrichment values), which approximates binding affinity. (D) AR antagonists had a greater effect on weaker binding sites. Fold changes were computed as −1/signal ratio and plotted as moving average with a window size of 100. Shown in black are linear trend lines. (E) Motif score distribution of the 15 bp perfect palindrome (Additional file: 1 Fig. S3B) for AR-bound sequences and 100 groups of randomly selected comparable sequences. The binding sites still occupied in the presence of the AR antagonists tend to have higher quality sequence motif (P < 0.01 for both compounds).
Figure 6
Figure 6
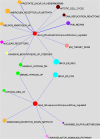
Signature enrichment analysis of drug-modulated direct activation (top panel) and repression targets (bottom panel) of AR. Shown are enriched gene signatures, with size of each node proportional to number of genes in the signature and width of each line proportional to statistical significance of the overlap between the signatures at the two ends. The signatures were colored by related biological concepts. Direct_AR-activation/Compound30-down_regulated targets refer to genes whose associated AR binding are impacted as well as mRNA level are significantly down-regulated upon Compound 30 treatment. Direct_AR-repression/Compound30-up_regulated targets refer to genes whose associated AR binding are impacted as well as mRNA level are significantly up-regulated upon Compound 30 treatment.

Similar articles

Cited by

References

    1. Chen CD, Welsbie DS, Tran C, Baek SH, Chen R, Vessella R, Rosenfeld MG, Sawyers CL. Molecular determinants of resistance to antiandrogen therapy. Nat Med. 2004;10:33–39. doi: 10.1038/nm972. - DOI - PubMed
    1. Scher HI, Sawyers CL. Biology of progressive, castration-resistant prostate cancer: directed therapies targeting the androgen-receptor signaling axis. J Clin Oncol. 2005;23:8253–8261. doi: 10.1200/JCO.2005.03.4777. - DOI - PubMed
    1. Koivisto P, Kononen J, Palmberg C, Tammela T, Hyytinen E, Isola J, Trapman J, Cleutjens K, Noordzij A, Visakorpi T. K: Androgen receptor gene amplification: a possible molecular mechanism for androgen deprivation therapy failure in prostate cancer. Cancer Res. 1997;57:314–319. - PubMed
    1. Visakorpi T, Hyytinen E, Koivisto P, Tanner M, Keinänen R, Palmberg C, Palotie A, Tammela T, Isola J. K: vivo amplification of the androgen receptor gene and progression of human prostate cancer. Nat Genet. 1995;4:401–406. - PubMed
    1. Nelson PS, Clegg N, Arnold H, Ferguson C, Bonham M, White J, Hood L, Lin B. The program of androgen-responsive genes in neoplastic prostate epithelium. PNAS. 2002;99:11890–11895. doi: 10.1073/pnas.182376299. - DOI - PMC - PubMed

MeSH terms

Substances