

Effective diagnosis of Alzheimer's disease by means of large margin-based methodology
- PMID: 22849649
- PMCID: PMC3512495
- DOI: 10.1186/1472-6947-12-79
Effective diagnosis of Alzheimer's disease by means of large margin-based methodology
Abstract
Background: Functional brain images such as Single-Photon Emission Computed Tomography (SPECT) and Positron Emission Tomography (PET) have been widely used to guide the clinicians in the Alzheimer's Disease (AD) diagnosis. However, the subjectivity involved in their evaluation has favoured the development of Computer Aided Diagnosis (CAD) Systems.
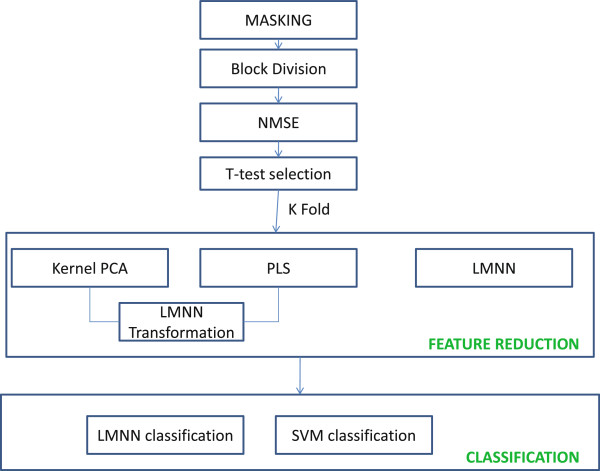
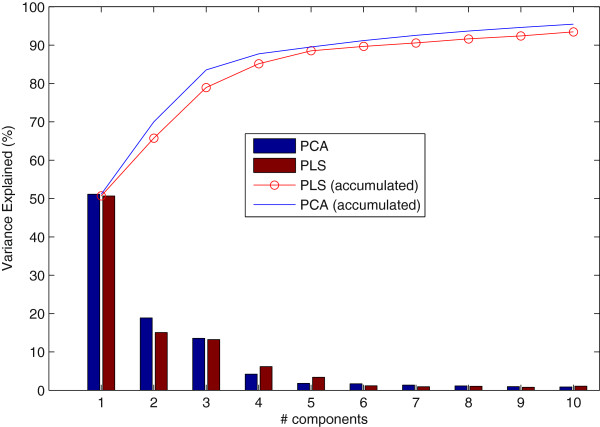
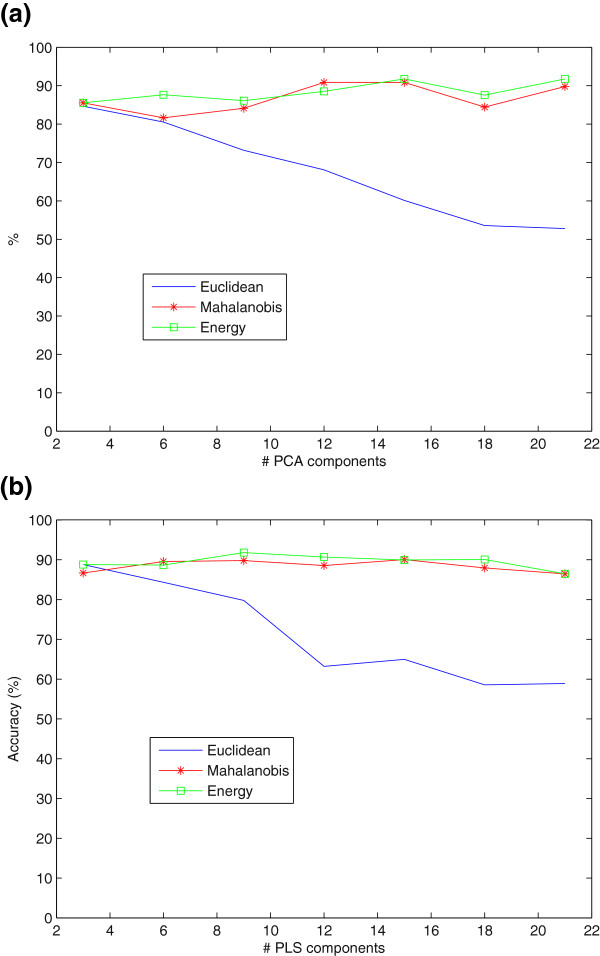
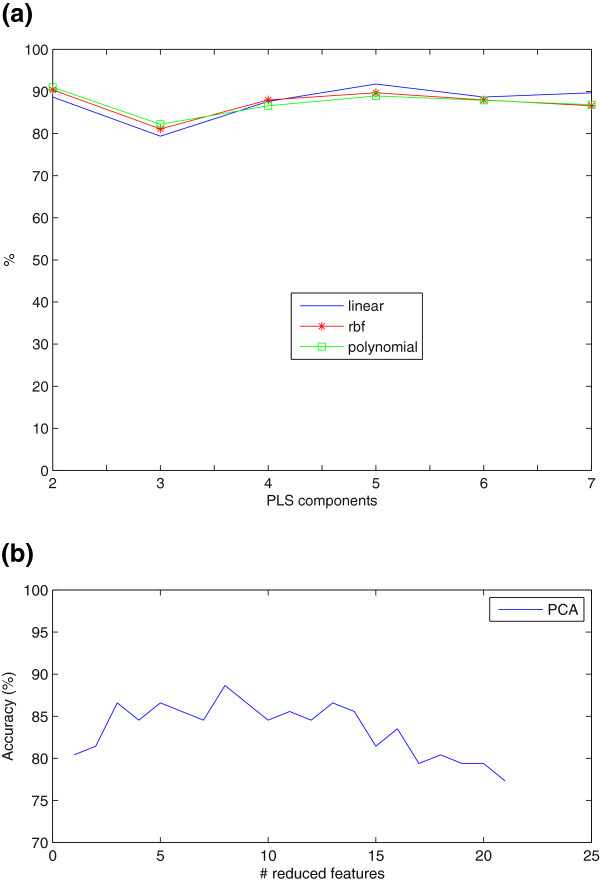
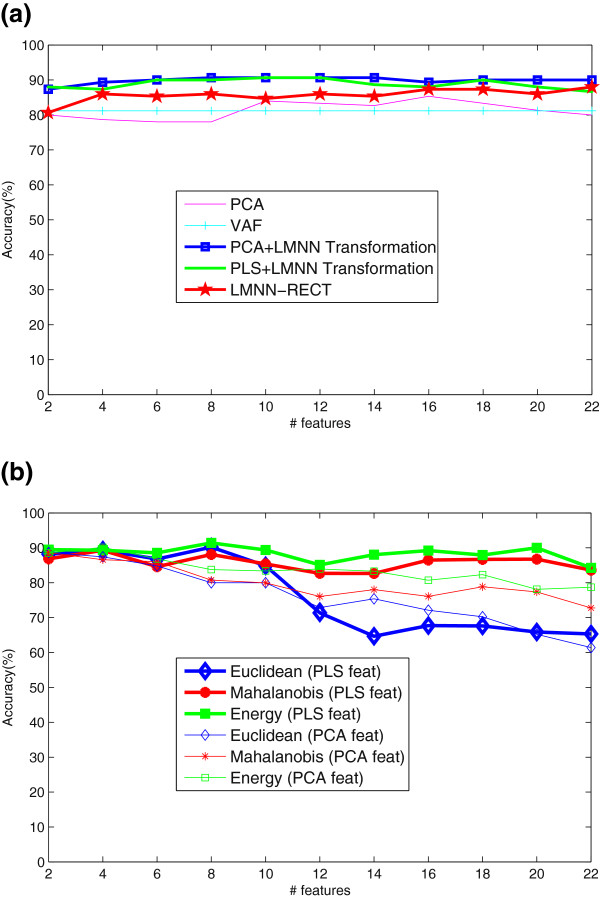
Methods: It is proposed a novel combination of feature extraction techniques to improve the diagnosis of AD. Firstly, Regions of Interest (ROIs) are selected by means of a t-test carried out on 3D Normalised Mean Square Error (NMSE) features restricted to be located within a predefined brain activation mask. In order to address the small sample-size problem, the dimension of the feature space was further reduced by: Large Margin Nearest Neighbours using a rectangular matrix (LMNN-RECT), Principal Component Analysis (PCA) or Partial Least Squares (PLS) (the two latter also analysed with a LMNN transformation). Regarding the classifiers, kernel Support Vector Machines (SVMs) and LMNN using Euclidean, Mahalanobis and Energy-based metrics were compared.
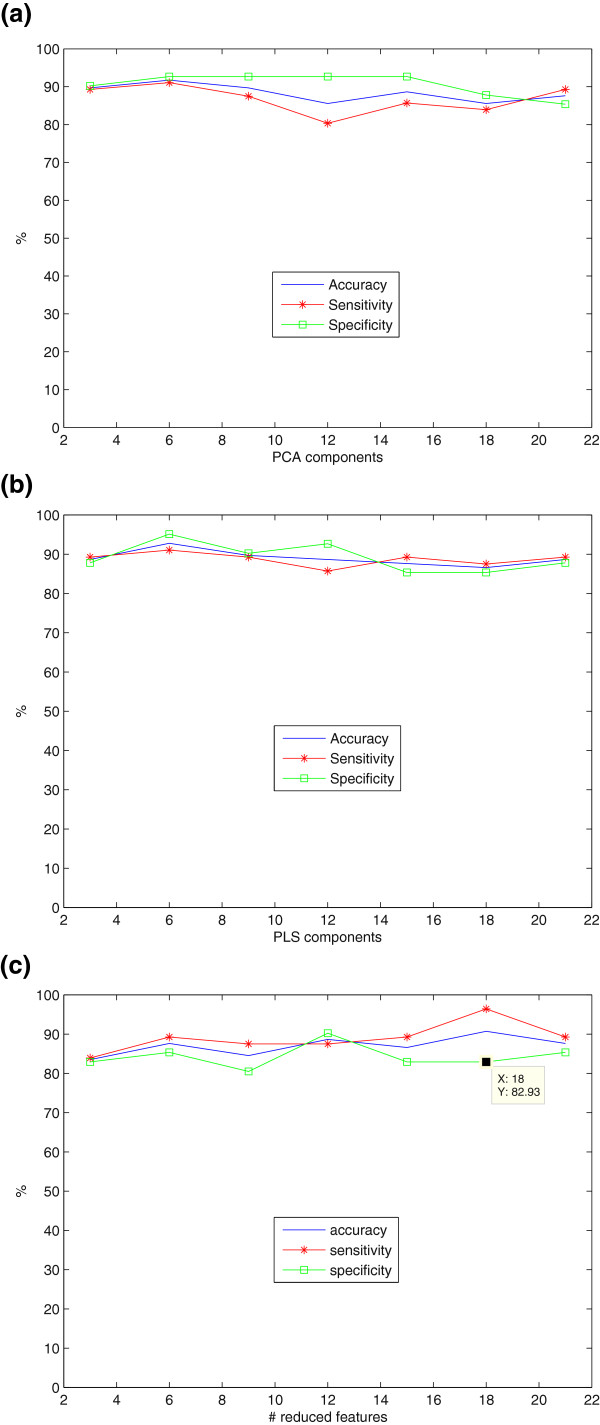
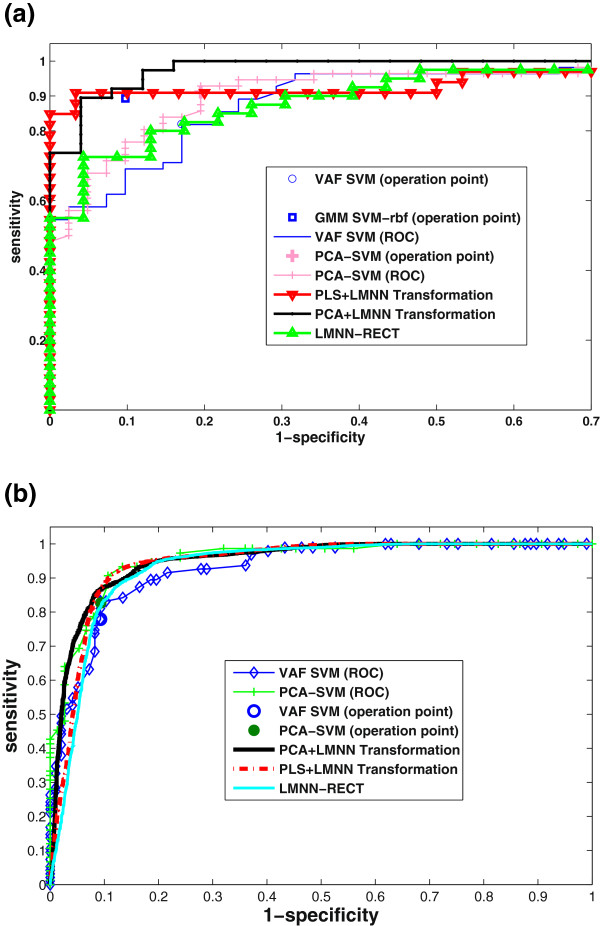
Results: Several experiments were conducted in order to evaluate the proposed LMNN-based feature extraction algorithms and its benefits as: i) linear transformation of the PLS or PCA reduced data, ii) feature reduction technique, and iii) classifier (with Euclidean, Mahalanobis or Energy-based methodology). The system was evaluated by means of k-fold cross-validation yielding accuracy, sensitivity and specificity values of 92.78%, 91.07% and 95.12% (for SPECT) and 90.67%, 88% and 93.33% (for PET), respectively, when a NMSE-PLS-LMNN feature extraction method was used in combination with a SVM classifier, thus outperforming recently reported baseline methods.
Conclusions: All the proposed methods turned out to be a valid solution for the presented problem. One of the advances is the robustness of the LMNN algorithm that not only provides higher separation rate between the classes but it also makes (in combination with NMSE and PLS) this rate variation more stable. In addition, their generalization ability is another advance since several experiments were performed on two image modalities (SPECT and PET).
Figures
Similar articles
-
SVM-based CAD system for early detection of the Alzheimer's disease using kernel PCA and LDA.Neurosci Lett. 2009 Oct 30;464(3):233-8. doi: 10.1016/j.neulet.2009.08.061. Epub 2009 Aug 28. Neurosci Lett. 2009. PMID: 19716856
-
SVM-based computer-aided diagnosis of the Alzheimer's disease using t-test NMSE feature selection with feature correlation weighting.Neurosci Lett. 2009 Sep 25;461(3):293-7. doi: 10.1016/j.neulet.2009.06.052. Epub 2009 Jun 21. Neurosci Lett. 2009. PMID: 19549559
-
Computer aided diagnosis system for the Alzheimer's disease based on partial least squares and random forest SPECT image classification.Neurosci Lett. 2010 Mar 19;472(2):99-103. doi: 10.1016/j.neulet.2010.01.056. Epub 2010 Feb 1. Neurosci Lett. 2010. PMID: 20117177
-
Analysis of SPECT brain images for the diagnosis of Alzheimer's disease based on NMF for feature extraction.Neurosci Lett. 2010 Aug 2;479(3):192-6. doi: 10.1016/j.neulet.2010.05.047. Neurosci Lett. 2010. PMID: 20641163
-
Combining Feature Extraction Methods to Assist the Diagnosis of Alzheimer's Disease.Curr Alzheimer Res. 2016;13(7):831-7. doi: 10.2174/1567205013666151116141906. Curr Alzheimer Res. 2016. PMID: 26567734
Cited by
-
Detection of Alzheimer's disease by displacement field and machine learning.PeerJ. 2015 Sep 17;3:e1251. doi: 10.7717/peerj.1251. eCollection 2015. PeerJ. 2015. PMID: 26401461 Free PMC article.
References
-
- Ramírez J, Górriz JM, Salas-Gonzalez D, Romero A, López M, Illán IA, Gómez-Río M. Computer-aided diagnosis of Alzheimer’s type dementia combining support vector machines and discriminant set of features. Inf Sci. 2009. doi:10.1016/j.ins.2009.05.012. - DOI
-
- English RJ, Childs J (Eds) SPECT: Single-Photon Emission Computed Tomography: A Primer. Society of Nuclear Medicine; 1996.
-
- Hellman RS, Tikofsky RS, Collier BD, Hoffmann RG, Palmer DW, Glatt S, Antuono PG, Isitman AT, Papke RA. Alzheimer disease: quantitative analysis of I-123-iodoamphetamine SPECT brain imaging. Radiology. 1989;172:183–188. - PubMed
-
- Holman BL, Johnson KA, Gerada B, Carvalho PA, Satlin A. The Scintigraphic Appearance of Alzheimer’s Disease: A Prospective Study Using Technetium-99m-HMPAO SPECT. J Nucl Med. 1992;33(2):181–185. - PubMed
Publication types
MeSH terms
Substances
Grants and funding
LinkOut - more resources
Full Text Sources
Medical
Miscellaneous
