. 2012 Sep;18(9):1635-55.
doi: 10.1261/rna.032284.112. Epub 2012 Jul 31.

Kinetic signatures of microRNA modes of action

Affiliations

Kinetic signatures of microRNA modes of action

Nadya Morozova et al. RNA. 2012 Sep.

Abstract

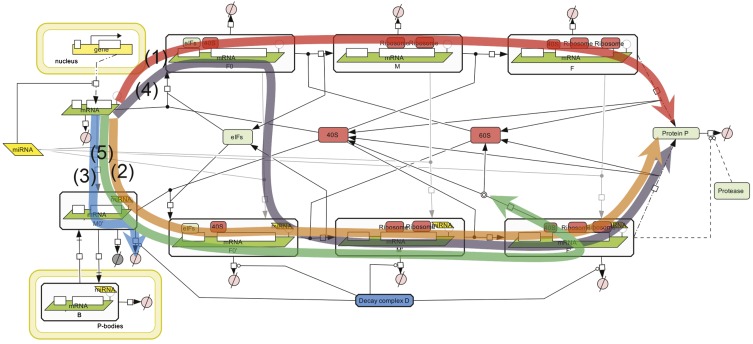
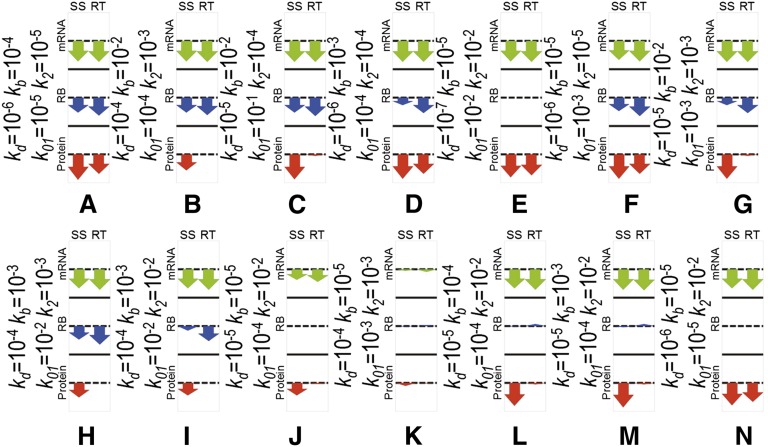
MicroRNAs (miRNAs) are key regulators of all important biological processes, including development, differentiation, and cancer. Although remarkable progress has been made in deciphering the mechanisms used by miRNAs to regulate translation, many contradictory findings have been published that stimulate active debate in this field. Here we contribute to this discussion in three ways. First, based on a comprehensive analysis of the existing literature, we hypothesize a model in which all proposed mechanisms of microRNA action coexist, and where the apparent mechanism that is detected in a given experiment is determined by the relative values of the intrinsic characteristics of the target mRNAs and associated biological processes. Among several coexisting miRNA mechanisms, the one that will effectively be measurable is that which acts on or changes the sensitive parameters of the translation process. Second, we have created a mathematical model that combines nine known mechanisms of miRNA action and estimated the model parameters from the literature. Third, based on the mathematical modeling, we have developed a computational tool for discriminating among different possible individual mechanisms of miRNA action based on translation kinetics data that can be experimentally measured (kinetic signatures). To confirm the discriminatory power of these kinetic signatures and to test our hypothesis, we have performed several computational experiments with the model in which we simulated the coexistence of several miRNA action mechanisms in the context of variable parameter values of the translation.


Figures

FIGURE 1.
FIGURE 1.
Possible mechanisms of microRNA action. (Black) The main steps of gene expression from DNA to protein. (Red) The RISC complex and the various levels at which it can inhibit gene expression; the mechanisms (M) are numbered as in Table 1 and are described in detail there.
FIGURE 2.
FIGURE 2.
The unifying mathematical model taking into account all nine mechanisms of miRNA action. (A) Created in Systems Biology Graphical Notation (SBGN) standard using CellDesigner 4.1 software (Funahashi et al. 2003). (B) Simplified schematic model presentation in the assumption that ribosomal subunits, initiation factors and miRNA are present in excess and their concentrations are fixed. The description of the reaction graph is given in the Materials and Methods section.
FIGURE 3.
FIGURE 3.
Kinetic signatures for nine individual mechanisms of microRNA action. Each plot shows a dynamics of three quantities: amount of mRNA (mRNA), average number of ribosomes per translated mRNA (RB), total amount of protein (Protein) in the time units measured in 1/kd, where kd is the equilibrium dissociation constant characterizing the intrinsic degradation rate of the mRNA in the absence of miRNA. Numbers on the y axis for mRNA and protein levels are arbitrary and should be interpreted based on the steady-state levels of mRNA amount, protein amount, and number of ribosomes per mRNA in the absence of miRNA. The left part of each plot corresponds to translation without miRNA, which is added at the time point 20 (shown by the dashed line). Three scenarios are simulated for each signature: strong, medium, and weak binding strength of miRNA to mRNA. The numbers on the graphs show relative change in the steady-state (ssmiRNA/ss) and change in the relaxation time (rt, measured in 1/kd). If three numbers are shown separated by a comma, they correspond to weak, medium, and strong miRNA binding. If only one number is shown, it means that the binding strength does not affect this quantity significantly. The arrow diagrams show relative changes in steady-state (SS) and relaxation time (RT) for three quantities: amount of mRNA (mRNA), number of ribosomes per mRNA (RB), and amount of protein (Protein).
FIGURE 4.
FIGURE 4.
Combination of multiple mechanisms of miRNA action. Combination of Cap Inhibition, 60S unit joining inhibition, Elongation, and Decay mechanisms are considered for the reference set of translation parameters and kb = 10−3. The arrow diagrams show relative changes in steady-state (SS) and relaxation time (RT) for three quantities: amount of mRNA (mRNA), number of ribosomes per mRNA (RB), and amount of protein (Protein). Four numbers on the left of each diagram show the strengths of four miRNA action mechanisms (Cap Inhibition, 60S Unit Joining Inhibition, Elongation Inhibition, and Decay, bottom-up).
FIGURE 5.
FIGURE 5.
Illustration of the hypothesis of microRNA action. In the same system, depending on the ratios of system parameters and consequent dominant system realization, a biochemist will arrive at different conclusions: (1) Protein is translated “normally,” microRNAs do not interfere (in red); (2) protein translation is inhibited by microRNA at the initiation step (in orange); (3) protein translation is inhibited by microRNA via degradation of mRNA (in blue); (4) protein translation is inhibited by microRNA by slowing down ribosome assembly (in purple); (5) protein translation is inhibited by microRNA through ribosome drop-off (in green).
FIGURE 6.
FIGURE 6.
Variation of internal parameters of the translational machinery. Cap Inhibition at 50%, 60S Unit Joining Inhibition at 50%, Elongation Inhibition at 50%, and Decay at 50%, and a variable set of internal translation parameters. The arrow diagrams show relative changes in steady-state (SS) and relaxation time (RT) for three quantities: amount of mRNA (mRNA), number of ribosomes per mRNA (RB), and amount of protein (Protein).

References

    1. Aleman LM, Doench J, Sharp PA 2007. Comparison of siRNA-induced off-target RNA and protein effects. RNA 13: 385–395 - PMC - PubMed
    1. Baek D, Villen J, Shin C, Camargo FD, Gygi SP, Bartel DP 2008. The impact of microRNAs on protein output. Nature 455: 64–71 - PMC - PubMed
    1. Bagga S, Bracht J, Hunter S, Massirer K, Holtz J, Eachus R, Pasquinelli AE 2005. Regulation by let-7 and lin-4 miRNAs results in target mRNA degradation. Cell 122: 553–563 - PubMed
    1. Baillat D, Shiekhattar R 2009. Functional dissection of the human TNRC6 (GW182-related) family of proteins. Mol Cell Biol 29: 4144–4155 - PMC - PubMed
    1. Bartel DP 2009. MicroRNAs: Target recognition and regulatory functions. Cell 136: 215–233 - PMC - PubMed

Publication types

LinkOut - more resources