. 2012 Sep 12;31(18):3678-90.
doi: 10.1038/emboj.2012.214. Epub 2012 Jul 31.

Mouse Rif1 is a key regulator of the replication-timing programme in mammalian cells

Affiliations

Mouse Rif1 is a key regulator of the replication-timing programme in mammalian cells

Daniela Cornacchia et al. EMBO J. .

Abstract

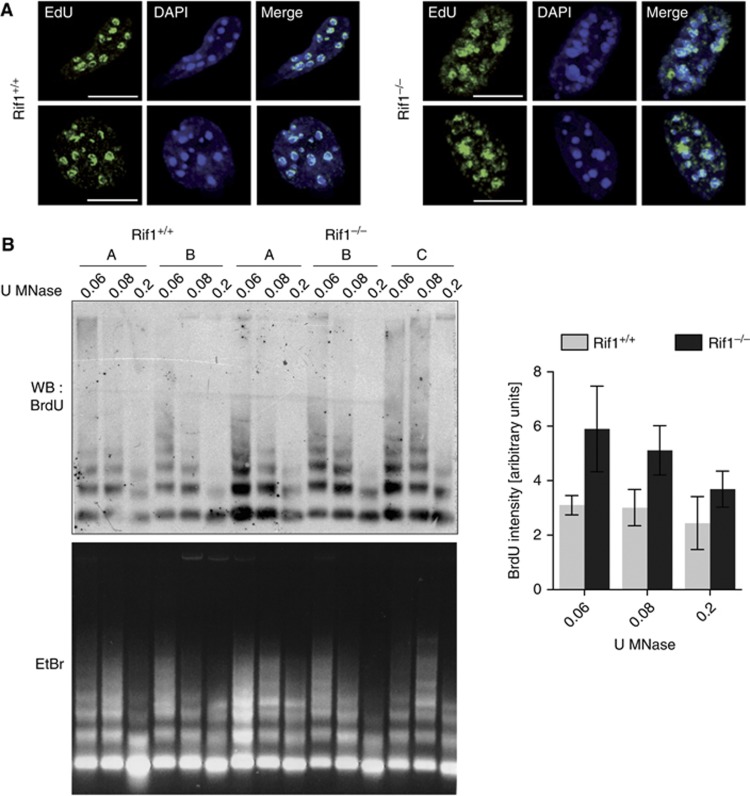
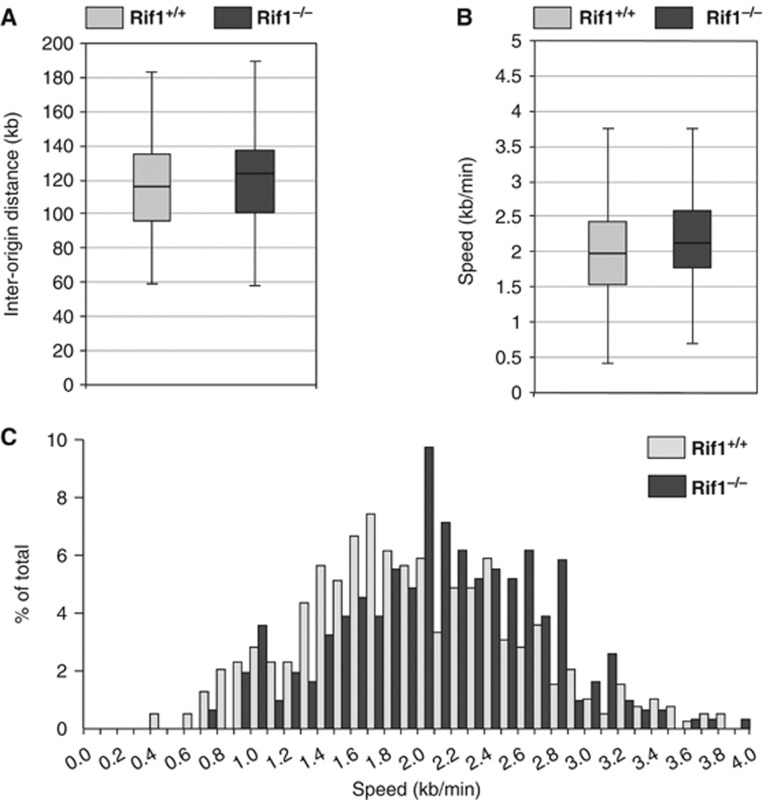
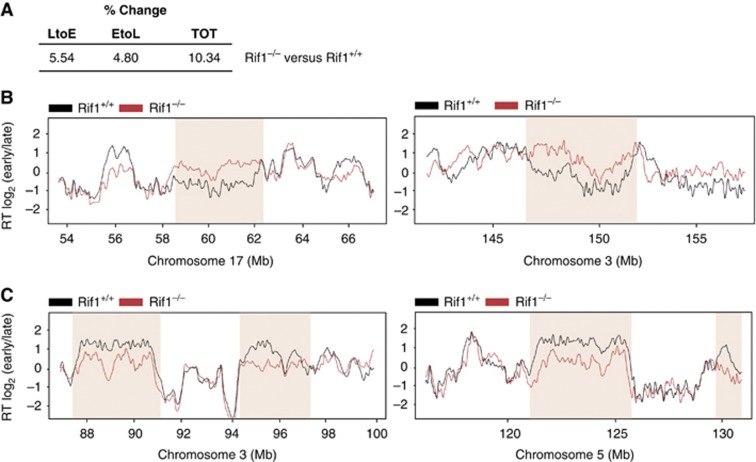
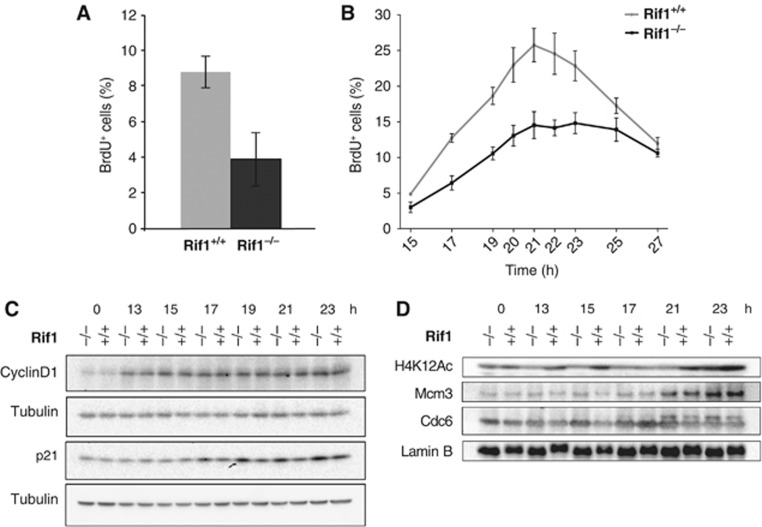
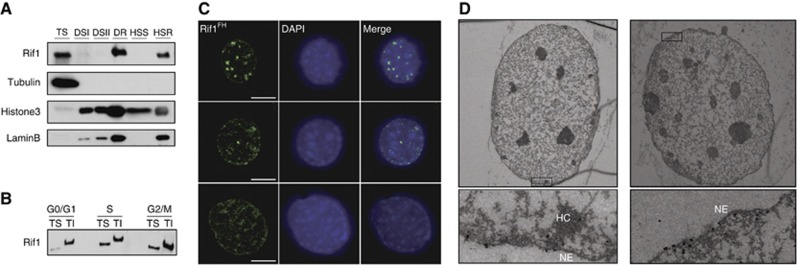
The eukaryotic genome is replicated according to a specific spatio-temporal programme. However, little is known about both its molecular control and biological significance. Here, we identify mouse Rif1 as a key player in the regulation of DNA replication timing. We show that Rif1 deficiency in primary cells results in an unprecedented global alteration of the temporal order of replication. This effect takes place already in the first S-phase after Rif1 deletion and is neither accompanied by alterations in the transcriptional landscape nor by major changes in the biochemical identity of constitutive heterochromatin. In addition, Rif1 deficiency leads to both defective G1/S transition and chromatin re-organization after DNA replication. Together, these data offer a novel insight into the global regulation and biological significance of the replication-timing programme in mammalian cells.


Conflict of interest statement

The authors declare that they have no conflict of interest.

Figures

Figure 1
Figure 1
Rif1 localization during G1 and G2. (A) Confocal microscope images of cells in different stages of G1 and early S identified by the intensity and distribution of MCM3 signal and EdU pattern. During G1, Rif1FH (anti-HA, green) shows a diffuse nuclear staining (DAPI, blue). It co-localizes with MCM3 (red) only during the latter part of early S (S3). EdU is shown in Cyan. Scale bar: 10 μm. (B) Cells in late S-phase and different G2/M stages were identified by staining for phosphorylated Ser10 histone H3 (H3S10ph, red). Rif1FH (anti-HA, green) returns to its diffuse localization during G2 (DAPI, blue). EdU is shown in Cyan. Scale bar: 10 μm.
Figure 2
Figure 2
Dynamic Rif1 localization during S-phase. (A) Confocal microscope images of fluorescently stained newly replicated DNA (EdU, red), immunofluorescence for Rif1FH (anti-HA, green) and DAPI (blue) in Rif1FH/FH MEFs. Scale bar: 10 μm. (B) Rif1 precedes replication at chromocenters. Magnifications of insets highlighted from (A). Scale bar: 2 μm.
Figure 3
Figure 3
Rif1 deficiency deregulates the replication-timing programme. (A) EdU staining (green) in Rif1−/− pMEFs reveals a mixed S2–S4 pattern as compared with wild-type cells (Figure 2, S2). A pan-nuclear EdU signal excluding nucleoli typical of S2 co-exists with the characteristic S4 pattern, identified by the typical EdU rings around the chromocenters. DAPI (blue). Scale bar: 10 μm. (B) Hierarchical clustering and correlation matrix heat map comparing replication-timing data (each an average of two bio-replicates) from pMEF Rif1+/+ and Rif1−/− to different cell types (previously published ESC, neural progenitor cells-NPC, Myoblasts, induced pluripotent Stem cells-iPSC) along with published wild-type MEF and two replicates of pMEF Rif1+/+ and Rif1−/−. (C) Table summarizing the percentages of changes comparing previously published wild-type MEFs with Rif1+/+ pMEFs and the latter with littermate Rif1−/− pMEFs. *As a reference, the % changes during ESCs differentiation into NPCs from Hiratani et al (2008) is shown. The percentage of changes is calculated as the number of probes on the array that change by a factor of more than 1 versus the total number of probes. (D) Exemplary regions (shaded) in chromosome 17 (left) and 3 (right) whose replication-timing switches from LtoE in Rif1−/− (red) compared with Rif1+/+ (black) pMEFs, shown by Loess smoothed replication-timing profiles. Profiles for the same region from male and female published wild-type MEFs are shown in green. (E) Exemplary regions (shaded) in chromosome 3 (left) and 5 (right) whose replication-timing switches from EtoL, depicted as in (D). (F) Distribution of replication-timing values in Rif1−/− versus Rif1+/+ cells. Two independent lines are shown for each genotype. (G) Comparison of early (blue) and late (red) domain size distribution between Rif1+/+, Rif1−/− and ESCs (*ESCs from Hiratani et al, 2008).
Figure 4
Figure 4
Consequences of Rif1 deletion on spatial replication-foci distribution. (A) In the absence of Rif1, cells with early replication spatial patterns accumulate. Upon 30′ EdU pulse, cells were fixed and stained for EdU. S-phase substages were evaluated by visual inspection of the cycling population. Pie charts show the relative proportion (percentage of total S) of early, mid and late S-phase. Cells were scored blinded for two independent Rif1+/+ and four Rif1F/F treated with CRE or EV pMEF clones. In all, 200 EdU+ cells were counted for each clone. Averages are shown. P-values early P<0.0001, mid=P<0.0001, late P<0.01. (B) Six independent Rif1+/+ and Rif1F/F pMEF clones treated with CRE or EV were pulse-labelled with BrdU and the percentage of positive cells was evaluated by FACS analysis. S-phase was subdivided into three equal fractions of increasing propidium iodide content to define early, mid and late S-phase. The ratio of the percentage of total BrdU-positive cells found in each S-phase fraction between EV and CRE treated was plotted.
Figure 5
Figure 5
Rif1 deficiency affects re-organization of newly replicated chromatin. (A) Rif1 deletion impairs post-replicative 3D re-organization of pHC. EdU staining (green) of cells in mid S-phase shows disorganization of newly replicated pHC in Rif1−/− cells. Scale bar: 10 μm. (B) BrdU pulse-labelled chromatin from two independent Rif1+/+ and three Rif1F/F; Rosa26CreERT2/+ (Rif1−/−) pMEFs treated with 4-hydroxytamoxifen was digested with different dilutions of MNase. DNA was extracted and used for Southern–Western with an anti-BrdU antibody (upper panel). The lower panel shows ethidium bromide staining of the agarose gel with the total DNA from MNase digested chromatin used for the Southern–Western. All the pMEFs lines showed a BrdU+ population around 4%, as quantified by FACS (not shown). The right panel shows the quantification of the BrdU immunoblot (WB) normalized for the major satellite Southern signal (SB) (Supplementary Figure S4C). U=enzymatic units.
Figure 6
Figure 6
Rif1 deficiency does not affect the frequency of origin-firing or replication fork speed. (A) Boxplot diagram of inter-origin distance measured on individual DNA fibres in Rif1−/− (n=38) and Rif1+/+ cells (n=53). (B) Boxplot diagram of replication fork speed measured on individual DNA fibres in Rif1−/− (n=309) and Rif1+/+(n=392). P-value=3,75 10−5. (A, B) Bottom and top of the box indicate the upper and lower quartiles, respectively, the line in the box the median and the whiskers the 1.5 IQR of the lower and upper quartile. (C) Fork speed distribution in Rif1−/− and Rif1+/+ cells.
Figure 7
Figure 7
Deregulation of replication timing is an immediate consequence of Rif1 deletion. pMEFs Rif1+/+ and Rif1F/F; Rosa26CreERT2/+ (Rif1−/−) were arrested in G0, 4-hydroxytamoxifen was administered in order to induce CRE-mediated deletion and the cells were released into a synchronous cell cycle. (A) Table summarizing changes in replication timing in the first cell cycle after Rif1 deletion, compared with Rif1+/+, as in Figure 3C (B) Loess smoothed replication-timing profile of the same regions (shaded) in chromosome 17 (left) and 3 (right) shown in Figure 3D whose replication-timing switches from LtoE in Rif1−/− (red) compared with Rif1+/+ (black) pMEFs during the first S-phase (first) upon Rif1 deletion. (C) Replication-timing profile of the same regions (shaded) in chromosome 3 (left) and 5 (right) shown in Figure 3E whose replication-timing switches from EtoL during the first S-phase (first) upon Rif1 deletion, depicted as in (B).
Figure 8
Figure 8
The absence of Rif1 impairs entry into the first S-phase after deletion. (A) Prolonged Rif1 deletion decreases the percentage of BrdU+ cells in an asynchronous population. A 30' BrdU pulse was given to three independent Rif1+/+ or Rif1F/F pMEF lines infected with a retrovirus encoding CRE recombinase (CRE). Bars show the average percentage of BrdU+ cells. (B) Rif1 deletion was induced as in Figure 7. S-phase progression was monitored by FACS analysis of BrdU content and the percentage of BrdU+ cells over the entire population was plotted versus time. An average of three independent pMEF lines for each genotype is presented. (C) Western blotting of Cyclin D1 and p21. Loading control: α-tubulin. h=hours. (D) Western blot of chromatin-bound Cdc6, MCM3, acetylated Lys12 histone H4 (H4K12-Ac). Loading control: lamin B. (C, D) One representative pair of Rif1+/+; Rosa26CreERT2/+ and Rif1F/F; Rosa26CreERT2/+(Rif1−/−), both+4-hydroxytamoxifen treated are shown.
Figure 9
Figure 9
Rif1 is associated with the nuclear matrix. (A) Western blotting on extracts from MEFs fractionated for nuclear matrix isolation. Anti-Rif1 antibody used was 1240. TS=triton soluble; DS=DNase soluble; DR=DNase resistant. The DR fraction was further divided in HSS=high salt soluble and HSR=high salt resistant. (B) Live MEFs were FACS sorted in three fractions (G1, S and G2) on the basis of their DNA content using Hoechst 33342. The cells collected were fractionated in triton-soluble (TS) and -insoluble fraction (TI). Western blot was performed on extracts from equal number of cells for each fraction using anti-Rif1 antibody 1240. The migration shift of Rif1 TI fraction band is probably caused by the presence of UREA 8 M (see Materials and methods). (C) Nuclear halos were prepared from Rif1FH/FH MEFs. Immunofluorescence for Rif1FH (anti-HA, green) and DAPI (blue). Scale bar: 10 μm. (D) Electron microscopy visualization of Rif1FH in triton pre-extracted MEFs. One representative ultra-thin section per each cell and magnification of insets highlighted are shown. The black dots correspond to the Nanogold particles associated to the secondary antibody. HC, heterochromatin; NE, nuclear envelope.

Comment in

References

    1. Anglana M, Apiou F, Bensimon A, Debatisse M (2003) Dynamics of DNA replication in mammalian somatic cells: nucleotide pool modulates origin choice and interorigin spacing. Cell 114: 385–394 - PubMed
    1. Aparicio JG, Viggiani CJ, Gibson DG, Aparicio OM (2004) The Rpd3-Sin3 histone deacetylase regulates replication timing and enables intra-S origin control in Saccharomyces cerevisiae. Mol Cell Biol 24: 4769–4780 - PMC - PubMed
    1. Bahtz R, Seidler J, Arnold M, Haselmann-Weiss U, Antony C, Lehmann WD, Hoffmann I (2012) GCP6 is a substrate of Plk4 and required for centriole duplication. J Cell Sci 125(Pt 2): 486–496 - PubMed
    1. Bartkova J, Horejsi Z, Koed K, Kramer A, Tort F, Zieger K, Guldberg P, Sehested M, Nesland JM, Lukas C, Orntoft T, Lukas J, Bartek J (2005) DNA damage response as a candidate anti-cancer barrier in early human tumorigenesis. Nature 434: 864–870 - PubMed
    1. Buonomo SB, Wu Y, Ferguson D, de Lange T (2009) Mammalian Rif1 contributes to replication stress survival and homology-directed repair. J Cell Biol 187: 385–398 - PMC - PubMed

Publication types

LinkOut - more resources