

doi: 10.1007/s10928-012-9260-6.
Epub 2012 Aug 1.
Dynamics of target-mediated drug disposition: characteristic profiles and parameter identification
Affiliations
- PMID: 22851162
- PMCID: PMC3446204
- DOI: 10.1007/s10928-012-9260-6
Item in Clipboard
Dynamics of target-mediated drug disposition: characteristic profiles and parameter identification
J Pharmacokinet Pharmacodyn.
2012 Oct.
Abstract
In this paper we present a mathematical analysis of the basic model for target mediated drug disposition (TMDD). Assuming high affinity of ligand to target, we give a qualitative characterisation of ligand versus time graphs for different dosing regimes and derive accurate analytic approximations of different phases in the temporal behaviour of the system. These approximations are used to estimate model parameters, give analytical approximations of such quantities as area under the ligand curve and clearance. We formulate conditions under which a suitably chosen Michaelis-Menten model provides a good approximation of the full TMDD-model over a specified time interval.
Figures
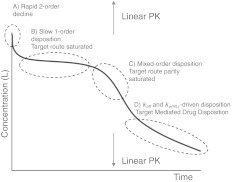
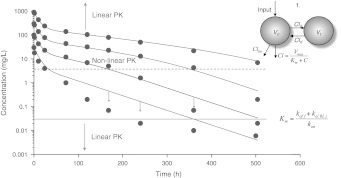
Characteristic ligand versus time graph in target-mediated drug disposition. The concentration of the ligand is measured on a logarithmic scale. In the first phase (A) drug and target rapidly equilibrate, in the second phase (B) the target is saturated and drug is mainly eliminated directly by a first order process, in the third phase (C) the target is no longer saturated and drug is eliminated directly, as well as in the form of a drug–target complex, and in the final, fourth phase (D) the drug concentration is so low that elimination is a linear first order process with direct as well as indirect elimination (as a drug–target complex)
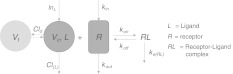
Schematic description of target-mediated drug (or ligand) disposition. The ligand L binds reversibly (k
on/k
off) to the target R to form the ligand–target complex RL, which is irreversibly removed via a first order rate process (k
e(RL)), and in addition is eliminated via a first order process (k
e(L) = Cl
(L)/V
c)
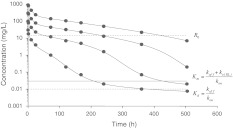
Semi-logarithmic graphs of the ligand plasma concentration versus time after the administration of four rapid intravenous injections D of 1.5, 5, 15 and 45 mg/kg, respectively (Data set (I)). The volume of the central compartment V
c for these doses was fixed at 0.05 L/kg. The dots are simulated data and the solid curves are obtained by fitting the model sketched in Fig. 2 to the data. Estimates are given in Table 2

Left semi-logarithmic graphs of simulated plasma concentrations of L (red discs) and R (blue squares) versus time (Data set (II)) and on the right the same, but also semi-logarithmic graphs of RL (green triangles) (Data set (III)), taken after administration of four rapid intravenous injections D of 1.5, 5, 15 and 45 mg/kg, respectively. V
c for these doses was fixed at 0.05 L/kg. The dots are simulated data and the solid curves are obtained by fitting the model sketched in Fig. 2 to the data. Estimates are given in Table 2

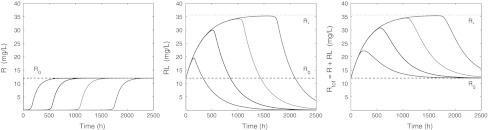
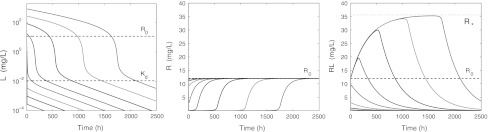
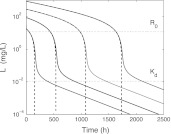
Graphs of L versus time on semi-logarithmic scale (left), on a linear scale (middle) and a close up (right), for doses resulting in initial ligand concentrations L
0 = 30, 100, 300, 900 mg/L and parameters listed in Table 3. In addition, R(0) = R
0 and RL(0) = 0. The dashed lines indicate the target baseline level R
0, and the dissociation constant K
d
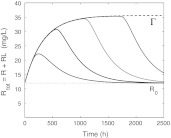
Graphs of R (left), RL (middle) and R
tot (right) versus time for L
0 = 30, 100, 300, 900 mg/L and parameters given in Table 3, whilst R(0) = R
0 and RL(0) = 0. The dashed line indicates the target baseline level R
0 and the dotted line the level R
*
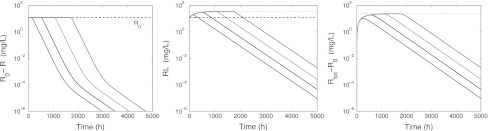
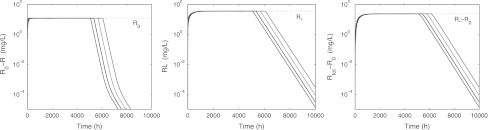
Graphs of R
0 − R (left), RL (middle) and R
tot − R
0 (right) versus time on a semi-logarithmic scale for L(0) = 30, 100, 300, 900 mg/L and R(0) = R
0 and RL(0) = 0 mg/L. The parameters are listed in Table 3. In the middle figure, the dashed line indicates the baseline R
0 and the dotted line the level R
*. In the right figure the dotted line indicates R
* − R
0
Graphs of L on a semi-logarithmic scale (left) and R (middle) and RL (right) on a linear scale versus time for L(0) = 0.3, 1, 3, 10, 30, 100, 300, 900 mg/L and R(0) = R
0 and RL(0) = 0. The parameters are listed in Table 3. The dashed lines indicate the baseline R
0 and K
d, and the dotted line the level R
*
Simulated graphs of R
tot(t) for the initial ligand concentrations L
0 = 30, 100, 300, 900 mg/L and data from Table 3, together with the curve  (dashed) given by the analytic expression (20). Notice how, as L
0 increases, the graph of R
tot(t) follows
(dashed) given by the analytic expression (20). Notice how, as L
0 increases, the graph of R
tot(t) follows  over a longer period of time
Graphs of L versus time on a semi-logarithmic scale for data as in Fig. 5. The dashed curves are the analytic approximations for the different drug doses, given by Eq. (25). Recall from Eq. (7) that K
d = 0.011 mg/L
Fitting the 2-compartment Michaelis–Menten model (45) to the data of Fig. 3 which are represented by the dots. The drawn curves are predictions of the Michaelis–Menten model for the parameter values listed in Table 4. The dashed line in the middle of the plot indicates the estimated value of K
M. Notice how far away it is from the original value of K
m—marked by the thin drawn line—which was estimated by the TMDD model
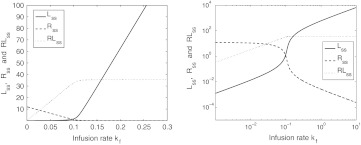
The steady state concentrations L
ss, R
ss and RL
ss graphed versus the infusion rate k
f, on a linear scale (left) and on a log-log scale (right) for parameter values taken from Table 3
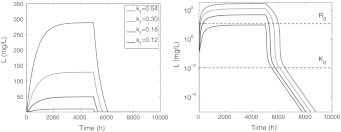
The ligand concentration L graphed versus time on a linear scale (left) and on a semi-logarithmic scale (right) for the infusion rates k
f = 0.12, 0.18, 0.30 and 0.54 (mg/L)/h and t
washout = 5000 h. The parameter values are taken from Table 3
Concentration profiles of R, RL and R
tot versus time caused by a constant rate infusion of 5000 h and infusion rates of k
f = 0.12, 0.18, 0.30 and 0.54 (mg/L)/h. The parameter values are taken from Table 3. Note that the time to full depletion of target R decreases as the infusion rate k
f of ligand increases
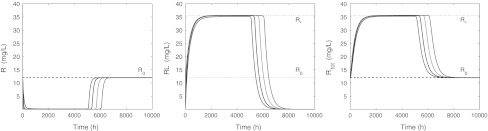
Graphs of R
0 − R, RL and R
tot − R
0 versus time when k
f= 0.12, 0.18, 0.30 and 0.54 (mg/L)/h. The parameter values are taken from Table 3. Note that the convergence of target R to R
0 is bi-exponential and that the decline of complex RL to zero, and the convergence of total target R
tot to R
0 are mono-exponential
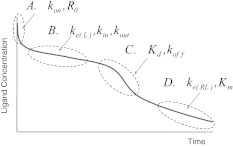
Schematic representation of how the parameters may be derived from properties of the four phases. In Phase A ligand binds to the receptor (k
on), during Phase B ligand is primarily eliminated directly (k
e(L)); time of termination yields information about k
in. In Phase C the saturation term is important (K
d), and in Phase D ligand elimination proceeds mainly though the receptor (k
e(RL))

Evolution of the quantity  with time for two initial doses L
0 = 300 and 900. Parameter values are taken from Table 1. Note the agreement with the analytical predictions made above for Phases B, C and D
with time for two initial doses L
0 = 300 and 900. Parameter values are taken from Table 1. Note the agreement with the analytical predictions made above for Phases B, C and D
Similar articles
-
Dynamics of target-mediated drug disposition.Eur J Pharm Sci. 2009 Dec 8;38(5):445-64. doi: 10.1016/j.ejps.2009.09.007. Epub 2009 Sep 26. Eur J Pharm Sci. 2009. PMID: 19786099
-
Dose correction for the Michaelis-Menten approximation of the target-mediated drug disposition model.J Pharmacokinet Pharmacodyn. 2012 Apr;39(2):141-6. doi: 10.1007/s10928-011-9233-1. Epub 2012 Jan 4. J Pharmacokinet Pharmacodyn. 2012. PMID: 22215144 Free PMC article.
-
Numerical validation and properties of a rapid binding approximation of a target-mediated drug disposition pharmacokinetic model.J Pharmacokinet Pharmacodyn. 2009 Jun;36(3):199-219. doi: 10.1007/s10928-009-9118-8. Epub 2009 May 12. J Pharmacokinet Pharmacodyn. 2009. PMID: 19434483
-
Target-mediated drug disposition model: approximations, identifiability of model parameters and applications to the population pharmacokinetic-pharmacodynamic modeling of biologics.Expert Opin Drug Metab Toxicol. 2009 Jul;5(7):803-12. doi: 10.1517/17425250902992901. Expert Opin Drug Metab Toxicol. 2009. PMID: 19505189 Review.
-
Small-Molecule Compounds Exhibiting Target-Mediated Drug Disposition (TMDD): A Minireview.J Clin Pharmacol. 2017 Feb;57(2):137-150. doi: 10.1002/jcph.804. Epub 2016 Sep 6. J Clin Pharmacol. 2017. PMID: 27489162 Review.
Cited by
-
Target-mediated drug disposition with drug-drug interaction, Part I: single drug case in alternative formulations.J Pharmacokinet Pharmacodyn. 2017 Feb;44(1):17-26. doi: 10.1007/s10928-016-9501-1. Epub 2017 Jan 10. J Pharmacokinet Pharmacodyn. 2017. PMID: 28074395 Free PMC article.
-
Therapeutic drug monitoring of immune checkpoint inhibitors: based on their pharmacokinetic properties and biomarkers.Cancer Chemother Pharmacol. 2023 Sep;92(3):165-179. doi: 10.1007/s00280-023-04541-8. Epub 2023 Jul 6. Cancer Chemother Pharmacol. 2023. PMID: 37410155 Review.
-
Impact of mathematical pharmacology on practice and theory: four case studies.J Pharmacokinet Pharmacodyn. 2018 Feb;45(1):3-21. doi: 10.1007/s10928-017-9539-8. Epub 2017 Sep 7. J Pharmacokinet Pharmacodyn. 2018. PMID: 28884259 Free PMC article.
-
Pharmacokinetic and pharmacodynamic considerations for the next generation protein therapeutics.J Pharmacokinet Pharmacodyn. 2015 Oct;42(5):553-71. doi: 10.1007/s10928-015-9447-8. Epub 2015 Sep 15. J Pharmacokinet Pharmacodyn. 2015. PMID: 26373957 Free PMC article. Review.
-
A Tutorial on Target-Mediated Drug Disposition (TMDD) Models.CPT Pharmacometrics Syst Pharmacol. 2015 Jun;4(6):324-37. doi: 10.1002/psp4.41. Epub 2015 Jun 15. CPT Pharmacometrics Syst Pharmacol. 2015. PMID: 26225261 Free PMC article.
References
-
- Michaelis L, Menten ML. Die Kinetik der Invertinwirkung. Biochem Z. 1913;49:333–369.
MeSH terms
Substances
LinkOut - more resources
Full Text Sources
Other Literature Sources
Medical
