. 2012 Sep 21;287(39):32598-616.
doi: 10.1074/jbc.M112.371005. Epub 2012 Jul 31.

Glycosphingolipids are essential for intestinal endocytic function

Affiliations

Glycosphingolipids are essential for intestinal endocytic function

Richard Jennemann et al. J Biol Chem. .

Abstract

Glycosphingolipids (GSLs) constitute major components of enterocytes and were hypothesized to be potentially important for intestinal epithelial polarization. The enzyme UDP-glucose ceramide glucosyltransferase (Ugcg) catalyzes the initial step of GSL biosynthesis. Newborn and adult mice with enterocyte-specific genetic deletion of the gene Ugcg were generated. In newborn mutants lacking GSLs at day P0, intestinal epithelia were indistinguishable from those in control littermates displaying an intact polarization with regular brush border. However, those mice were not consistently able to absorb nutritional lipids from milk. Between postnatal days 5 and 7, severe defects in intestinal epithelial differentiation occurred accompanied by impaired intestinal uptake of nutrients. Villi of mutant mice became stunted, and enterocytes lacked brush border. The defects observed in mutant mice caused diarrhea, malabsorption, and early death. In this study, we show that GSLs are essential for enterocyte resorptive function but are primarily not for polarization; GSLs are required for intracellular vesicular transport in resorption-active intestine.


Figures

FIGURE 1.
FIGURE 1.
Ugcg cloning strategy, GSL synthesis pathway, genotyping, and cre activity determination. A, Ugcg gene deletion was initiated by generating mice expressing loxP-flanked Ugcg alleles together with cre recombinase under the villin promoter. B, GSL synthesis pathway in newborn and adult mice. The red boxes show GSLs expected to be absent in Ugcg f/f/VilCre mice. Yellow labeled GSLs LacCer and GM2 in newborns as well as LacCer and GA2 in adult mice intestine represent intermediates that are immediately used to synthesize higher GSL products; for nomenclature of GSL, see Ref. . C, mutant mice were genotyped by PCR, and Ugcg gene deletion could be confirmed by Southern blot analysis (D, values from densitometry on top). E, cre activity in the intestine has been indicated by a dark blue staining in mice expressing the villin-cre transgene in combination with a lacZ reporter gene throughout the whole intestine. The stomach tested negative. F, GSL analysis of intestinal compartments of Ugcg f/f/VilCre mice confirmed the results obtained by lacZ staining and Southern blot. Glycosphingolipids were depleted throughout the whole intestinal epithelium. Contr., control.
FIGURE 2.
FIGURE 2.
Sphingolipid analysis. A, GSLs as synthesis products of Ugcg were depleted in mutant tissue already in newborn mice at day P0. B, as revealed by mass spectrometry, the total GlcCer depletion rate in newborn Ugcg f/f/VilCre mice at P0 was >90% (controls (Contr.) and mutant, n = 3, respectively). A minor GlcCer fraction with sphingosine and nonhydroxylated fatty acids in its ceramide anchor was not affected by the Ugcg-gene deletion and might likely be originated from cells in which the cre recombinase was not active. C, sphingomyelin in mutant intestine had a similar concentration as in control tissue, and ceramide content increased slightly in Ugcg f/f/VilCre intestine as compared with controls. D, phospholipid content was not altered in newborn Ugcg f/f/VilCre mice at P0 (n = 4, respectively). E, intestinal phospholipid concentrations significantly decreased in mutant tissue at P5 to P7 (PE, phosphatidylethanolamine; PG, phosphatidylglycerol; PC, phosphatidylcholine), controls and Ugcg f/f/VilCre, n = 6 each.
FIGURE 3.
FIGURE 3.
Newborn Ugcg f/f/VilCre mice, although depleted of GSLs, show no conspicuous phenotype at P0. (A, A′, E, and E′) The brush border marker protein villin was expressed in wild type and mutant mice at postnatal day P0. B and F, presence of an intact brush border could be confirmed by electron microscopy. C and G, as shown by anti-Ki67, no differences in proliferation were apparent between control and mutant mice. D and D′, GSL GM1 was found ubiquitously distributed in vesicle-like structures within the cytosol of enterocytes. H and H′, Ugcg f/f VilCre intestine stained negative for GM1. Scale bars, light microscopy, 100 μm; EM, 1 μm. Contr., control.
FIGURE 4.
FIGURE 4.
Ugcg-deficient mice showed retarded postnatal weight gain and loss of body fat deposits. A, Ugcg f/f/VilCre mice were of smaller size and displayed insignificant gain of weight (A, inset). B and C, control mice (B) and mutant mice (C) contained milk in their stomachs (arrows) 1 week after birth demonstrating successful suckling. D and E, gonadal fat deposits observed in controls (D, arrows) were not observed in mutant mice (E). Stools in the rectum of mutant mice appeared soft and still displayed milk-like color.
FIGURE 5.
FIGURE 5.
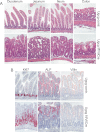
Ugcg f/f/VilCre mice exhibited major structural defects in the intestine and impaired distribution of intestinal proteins 1 week after birth. A, H&E staining of intestinal segments was as indicated. Pronounced structural defects were recognized in the mucosa of the small intestine of mutant mice with loss of villi and flattening of the mucosa as well as increased epithelial vacuolization. B, immunohistochemistry of polarization and proliferation marker of newborn mice at postnatal day P7. As exemplarily shown for sections of the jejunum, intestine from Ugcg-deficient mice displayed high levels of cell proliferation (Ki67). Mutant mice showed a patchy distribution of alkaline phosphatase expression (ALP) and almost a complete absence of the structural protein villin, both of which were present in the microvillar region of intact intestinal mucosa in control mice; scale bars, 100 μm. Contr., control.
FIGURE 6.
FIGURE 6.
Mice lacking glycosphingolipids in the intestine showed loss of lipid depots and drastically reduced lipid uptake. A–F, using Nile red, epithelium of mutant intestine at P0 (B) and P7 (E) showed a drastic reduction of lipid droplets as compared with respective controls (A and D). C and F, for quantification of the mean fluorescence of lipids per villus. 10–15 villi per animal were taken (n = 4, controls; n = 2, mutant at postnatal day P0, as well as n = 4, controls; and n = 3, mutant at postnatal day P6/P7). G and H, fatty acid uptake by the intestine was markedly reduced in mutant mice (H) as compared with controls (G). I, quantification of the mean fluorescence per villus of NBD-stearic acid uptake 10 min after intestinal administration; 10–15 villi per animal were measured. Shown is one out of three independent experiments with similar results, and n = 4 for each group, respectively. Scale bars, 100 μm; **, p < 0.01. J and K, electron micrographs stained with ruthenium red. Mutant Ugcg f/f/VilCre intestine (K) showed loss of microvillar brush border (mv) and lack of caveolae (arrows) as well as smaller and fewer fat containing lipid droplets (LD) in the cytoplasm of enterocytes as compared with wild type control (J). l, lysosomes; m, mitochondria; scale bars, 1 μm; Contr., control.
FIGURE 7.
FIGURE 7.
Ugcg f/f VilCre mice lost lipids by fecal excretion. A–C, lipids, fatty acids (A, TLC; B, quantification), and cholesterol (A, TLC; C, quantification) accumulated in feces of Ugcg-deficient mice; controls and Ugcg f/f/VilCre, n = 6 each. D and E, bile acids (D) and lipase activity (E) in feces were unaltered indicating their intact secretion from bile duct and pancreas into the intestinal lumen. F–I, Ugcg f/f/VilCre mice lost subcutaneous fat deposits. Histology showed that control (F) and mutant mice (H) had subcutaneous fat tissue (sf) on the day of birth, which was no longer present in Ugcg-deficient animals 1 week later (I). G, in contrast, control animals showed an increased fat storage. J, as a consequence of the disturbed intestinal fat uptake, plasma triglyceride concentrations were significantly reduced in mutant mice at P7; controls (Contr.), n = 11 and Ugcg f/f/VilCre, n = 8. K–M, Ugcg f/f/VilCre mice displayed reduced intestinal glucose uptake. The absorption experiment of NBD-labeled glucose was performed according to uptake of NBD-stearate. Both control (K) and mutant newborn mice (L) absorbed NBD-glucose. However, the uptake was less in mutant intestine (L). M, quantification of the medium fluorescence per villus after NBD-glucose uptake, 10 min after intestinal administration; measured were 10–15 villi per animal (n = 2, each). N, mutant mice were able to absorb lactose after its digestion into galactose and glucose completely but sialylated lactose accumulated in their feces. O and P, Ugcg f/f VilCre mice showed reduced sialidase activity in the small intestine. Sialidase activity in intestinal cell lysates was measured by digestion of sialylated lactose for 30 min, n = 4 for each group (O), or in a time-dependent manner as indicated (P), and were quantified by a Shimadzu CS 9000 densitometer (O′ and P′); *, p < 0.05; **, p < 0.01; ***, p < 0.001; scale bars, 100 μm.
FIGURE 8.
FIGURE 8.
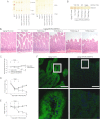
Ugcg f/f/VilCreERT2 mice showed severe structural alterations in the intestine shortly after induction of the Ugcg gene deletion. Ugcg control and mutant mice were treated for 3 consecutive days with 1 mg of tamoxifen (TAM), respectively. A, GSLs in the intestine were absent 4 days past the initial tamoxifen application (left and right TLCs represent neutral and acidic GSLs) and were remarkably reduced by ∼50 and ∼70% already 1 and 2 days after the initial induction (B). The remaining bands in extracts of mutant intestine migrating at the height of GM3 might be explained by admixtures of both intestinal muscle and stroma that were not affected by the Ugcg gene deletion. The degree of GSL depletion (B) correlated well with the dramatic alterations of the structure of the small intestine as shown by hematoxylin/eosin staining (B′). C–E, controls and Ugcg f/f/VilCreERT2, n = 5; heterozygous mice, n = 3). Shortly after induction, Ugcg f/f/VilCreERT2 mice showed reduction of bodyweight (C) as well as a lower food (D) and water consumption (E). Heterozygous mice developed similar to other controls. F, uptake of liposomes is impaired in Ugcg f/f/VilCreERT2 mice. Liposomes were rapidly endocytosed by control intestine. In mutant intestine the uptake of liposomes is drastically diminished or absent; scale bars, 100 μm. Contr., control.
FIGURE 9.
FIGURE 9.
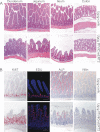
Severe structural defects occurred in small and large intestine of Ugcg f/f/VilCreERT2 mice. A, major structural defects similar as in newborn Ugcg f/f/VilCre mice 1 week after birth were also recognized in the mucosa of the small and large intestine of Ugcg f/f/VilCreERT2 mutant mice 3–4 days upon tamoxifen induction. More obvious than in newborn mutants, in Ugcg f/f/VilCreERT2 intestines enterocytes detached from the basal lamina. B, highly increased proliferation (Ki67 and EDU) indicated by red nuclei, and drastically decreased expression of the brush border proteins alkaline phosphatase (ALP) and villin were observed in tamoxifen-induced mutants devoid of GSL, similar as in newborn Ugcg f/f/VilCre mice. Scale bars, 100 μm. Contr., control.
FIGURE 10.
FIGURE 10.
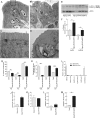
Tamoxifen-induced Ugcg f/f/VilCreERT2 mice show loss of brush border as well as increased autophagy and apoptosis. A–D, electron micrographs of adult control mice (A and C, magnification) and tamoxifen-induced Ugcg f/f/VilCreERT2 mice (B and D, magnification). Sections were stained according to Karnovsky et al. (19). Adult mice lacking GSLs in enterocytes showed loss of brush border (B and D) similar as seen in newborn mutants. In addition, increased numbers of multivesicular bodies (*) and marked autophagy (arrows) were detected in the cytoplasm of enterocytes of induced mutant mice (B and D); scale bars, 1 μm. E, Lc3 II expression, a marker of autophagy, was significantly elevated in tamoxifen-induced Ugcg f/f/VilCreERT2 mice as compared with their respective controls (F, quantification). G, similar as in Ugcg f/f/VilCre newborn mutant mice 1 week after birth; the phospholipid concentration in the intestine decreased significantly; controls, n = 6, and Ugcg f/f/VilCre, n = 4. H, as revealed by TLC analysis, ceramide concentration in jejunum of Ugcg f/f/VilCreERT2 increased significantly and was stronger than in newborn mutant mice. The total sphingomyelin (SM) content was not altered; controls, n = 6, and Ugcg f/f/VilCre, n = 4. I–K, LC-MS/MS quantification of GlcCers, ceramides, and SM. I, total GlcCer depletion rate in adult Ugcg f/f/VilCreERT2 mutants reached similar levels (>90%) as in newborn mice at P0 (controls and mutant, n = 3, respectively). Similar as in newborns, a GlcCer fraction with sphingosine and nonhydroxylated fatty acids in its ceramide anchor was not affected by the Ugcg gene deletion. J, further MS analysis indicated that ceramide levels increased in mutant tissue and confirmed the data obtained from TLC analysis. K, total SM levels were similar in control and mutant intestine; however, the SM composition changed qualitatively (data not shown). L and M, increased ceramide concentrations in enterocytes may have contributed to the higher number of TUNEL-positive cells per villus in tamoxifen-induced adult mutant Ugcg f/f/VilCreERT2 (M) as compared with newborn Ugcg f/f/VilCre mice (L); n = 4 each. *, p < 0.05; **, p < 0.01; ***, p < 0.001. Contr., control.
FIGURE 11.
FIGURE 11.
Ugcg f/f/VilCreERT2 mice showed reduced expression of β-catenin in luminal epithelial cells at day 4 upon tamoxifen treatment. A and B, villous epithelial cells were stained with an anti E-cadherin- (A) or β-catenin antibody (B). The apical brush border was counterstained with anti-villin. E-cadherin accumulated in enterocytes (A). Particularly in the heads of villi of mutant mice, detachment of enterocytes from the basal membrane and consequently partial disruption of the columnar epithelium occurred, and also β-catenin staining was reduced in Ugcg f/f/VilCreERT2 mice (B); scale bars, 100 μm. C and D, results obtained by immunofluorescence could be confirmed by Western blot analysis. Contr., control.
FIGURE 12.
FIGURE 12.
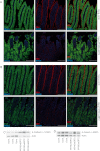
GM1 to a major extent was found apically in vesicular structures in the cytosol and stained negative in mutant mouse tissue. All stainings shown were performed on intestinal jejunum sections collected 5–7 days after birth. Animals of the same age (littermates) were compared. A and B, costaining of GM1 together with villin. In contrast to newborn mice at day P0 in which GM1 was ubiquitously located in small dots in the cytosol of the epithelium, 1 week after birth GM1 located predominantly on the apical site of the enterocytes (A). The structural protein villin was stained in the brush border, but only a small overlap could be seen together with GM1. GM1 was stained to a major extent apically, apart from the brush border. B, in mutant tissue, as expected, GM1 could not be detected but also villin expression was very weak. C and D, costaining of GM1 and clathrin. In control tissue GM1 and clathrin were found in similar regions apically in the enterocytes (C). Clathrin expression was much less pronounced in mutant epithelium but was still present in the intestinal zona muscularis propria (D). E and F, costaining of GM1 together with the recycling endosomal marker protein Rab11. GM1 could be located apically in similar regions as Rab11 (E). Rab11 staining in mutant intestine was very weak (F). G, Lamp1-positive lysosomes were stained and were regularly distributed in the cytosol of the intestinal epithelium of control mice. H, in mutant tissue, Lamp1 staining appeared weaker, and lysosomes were irregularly distributed within the cytosol of the enterocytes. I–K, Western blot analysis revealed drastically decreased levels of clathrin and caveolin-1, proteins involved in endocytosis (I) as well as Rab11 as a marker for recycling endosomes important for protein recycling (J). The early endosomal marker proteins Rab4 and Rab5 showed similar expression in control and mutant tissue (K). Contr., control.
FIGURE 13.
FIGURE 13.
By immune electron microscopy, GSLs predominantly localize in vesicles close to the brush border. A–C, immunogold EM stainings of GM1 in control intestine of newborn mice at P5. GM1 was visualized associated in vesicles, below the brush border (mv) and in the region of the glycocalyx (gc) (A, arrows). Only rudimentary staining was seen in the microvilli. B, GSL-containing vesicles seemed to release their content at the apical membrane of the enterocytes into the intestinal lumen and intracellularly into lipid depots (LD) (A and C). D, only scarce unspecific gold particles were observed in enterocytes of Ugcg f/f/VilCre mice. E and F, immunogold EM costaining of GM1 (10 nm gold particles) with clathrin (5-nm gold particles) in newborn control (E) and mutant mice (F) at P5. Clathrin-coated pits (arrows) originate in wild type mice mostly independent from GSLs at the apical membrane of the enterocytes (E). Only few clathrin-positive dots colocalized with GM1 vesicles (arrowheads). In mutant mice GM1 and clathrin were almost completely absent (F). G, similar as clathrin, also Rab11 (10-nm gold particles, arrowheads) predominantly did not colocalize with GM1 vesicles (G, arrows, 5-nm gold particles) with a few exceptions (inset). H, only a background staining for GM1 and a reduced Rab11 staining was seen in mutant tissue. I–L, in adult animals, the GSL GA1, similar as GM1 in newborns, also localized in vesicles. GSL (GA1)-associated vesicles (I, arrows) are present in a layer close to the brush border (J) or in lipid droplets (LD) (K) similarly to the location of GSLs in newborn animals 1 week after birth. L, Ugcg f/f/VilCreERT2 intestine showed only a few unspecific gold particles; m, mitochondria; scale bars, 200 nm. Contr., control.

Similar articles

Cited by

References

    1. Christiansen K., Carlsen J. (1981) Microvillus membrane vesicles from pig small intestine. Purity and lipid composition. Biochim. Biophys. Acta 647, 188–195 - PubMed
    1. Lingwood D., Simons K. (2010) Lipid rafts as a membrane-organizing principle. Science 327, 46–50 - PubMed
    1. Hansen G. H., Pedersen J., Niels-Christiansen L. L., Immerdal L., Danielsen E. M. (2003) Deep-apical tubules. Dynamic lipid-raft microdomains in the brush-border region of enterocytes. Biochem. J. 373, 125–132 - PMC - PubMed
    1. Tamboli I. Y., Prager K., Barth E., Heneka M., Sandhoff K., Walter J. (2005) Inhibition of glycosphingolipid biosynthesis reduces secretion of the β-amyloid precursor protein and amyloid β-peptide. J. Biol. Chem. 280, 28110–28117 - PubMed
    1. Sprong H., Degroote S., Claessens T., van Drunen J., Oorschot V., Westerink B. H., Hirabayashi Y., Klumperman J., van der Sluijs P., van Meer G. (2001) Glycosphingolipids are required for sorting melanosomal proteins in the Golgi complex. J. Cell Biol. 155, 369–380 - PMC - PubMed

Publication types