. 2012 Sep 21;287(39):32588-97.
doi: 10.1074/jbc.M112.362509. Epub 2012 Jul 31.

A short polybasic segment between the two conserved domains of the β2a-subunit modulates the rate of inactivation of R-type calcium channel

Affiliations

A short polybasic segment between the two conserved domains of the β2a-subunit modulates the rate of inactivation of R-type calcium channel

Erick Miranda-Laferte et al. J Biol Chem. .

Abstract

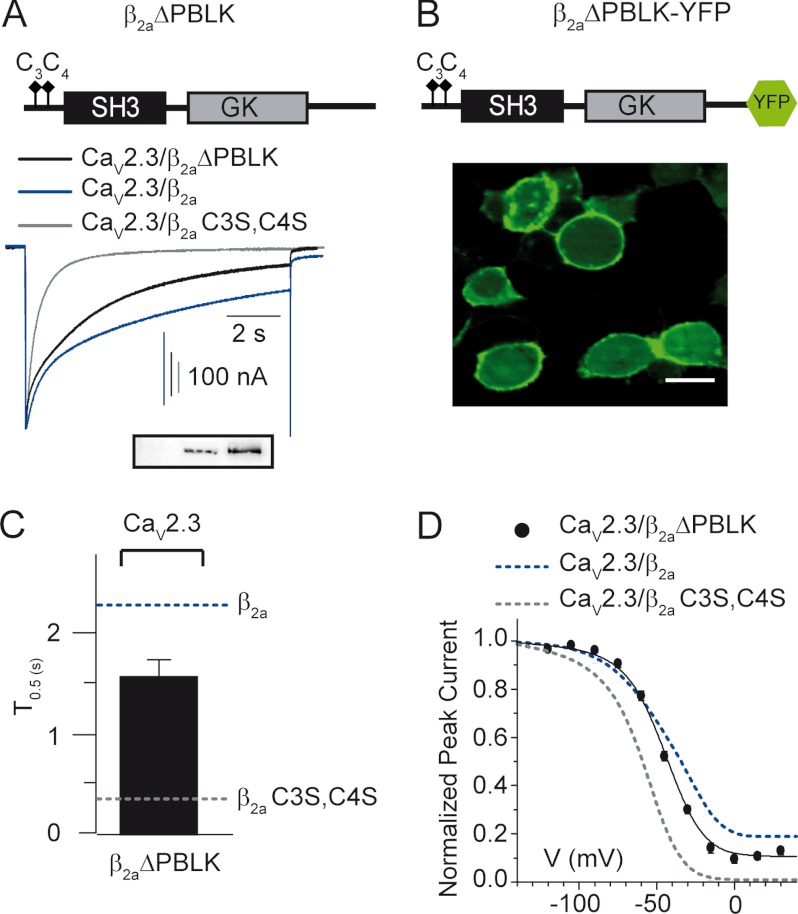
Besides opening and closing, high voltage-activated calcium channels transit to a nonconducting inactivated state from which they do not re-open unless the plasma membrane is repolarized. Inactivation is critical for temporal regulation of intracellular calcium signaling and prevention of a deleterious rise in calcium concentration. R-type high voltage-activated channels inactivate fully in a few hundred milliseconds when expressed alone. However, when co-expressed with a particular β-subunit isoform, β(2a), inactivation is partial and develops in several seconds. Palmitoylation of a unique di-cysteine motif at the N terminus anchors β(2a) to the plasma membrane. The current view is that membrane-anchored β(2a) immobilizes the channel inactivation machinery and confers slow inactivation phenotype. β-Subunits contain one Src homology 3 and one guanylate kinase domain, flanked by variable regions with unknown structures. Here, we identified a short polybasic segment at the boundary of the guanylate kinase domain that slows down channel inactivation without relocating a palmitoylation-deficient β(2a) to the plasma membrane. Substitution of the positively charged residues within this segment by alanine abolishes its slow inactivation-conferring phenotype. The linker upstream from the polybasic segment, but not the N- and C-terminal variable regions, masks the effect of this determinant. These results reveal a novel mechanism for inhibiting voltage-dependent inactivation of R-type calcium channels by the β(2a)-subunit that might involve electrostatic interactions with an unknown target on the channel's inactivation machinery or its modulatory components. They also suggest that intralinker interactions occlude the action of the polybasic segment and that its functional availability is regulated by the palmitoylated state of the β(2a)-subunit.


Figures

FIGURE 1.
FIGURE 1.
Co-injection of CaVα1-cRNA with β-proteins in Xenopus oocytes recapitulates CaV2.3 channel modulation. A, strategy for CaVα1 cRNA/β-protein co-injection. The cRNA encoding for CaVα1-subunit is injected into X. laevis oocytes 1 h before recombinant β-subunit injection. Electrophysiological recordings are performed 5–6 days later. B, representative current traces from oocytes injected with CaV2.3 encoding cRNA and the indicated β-protein during a 10-s pulse to 0 mV from a holding potential of −90 mV. Bar plot shows average of T0.5 values for the indicated channel subunit combination. Values are expressed as mean ± S.E. The dashed line corresponds to T0.5 for CaV2.3 channels expressed alone (in the absence of β-subunit). C, voltage-dependent inactivation curves from oocytes injected with CaV2.3 encoding cRNA and the indicated β-protein. The degree of inactivation was determined after a 10-s pre-pulse ranging from −120 to +30 mV in 15-mV increments from a holding potential of −90 mV followed by short deactivation pulse to −90 mV and a 0.5-s test pulse at 0 mV. Continuous lines correspond to double Boltzmann distributions that best fit the experimental data for the indicated subunit combination. For comparison, the fit to the inactivation curve obtained with CaV2.3 expressed alone is shown by a dotted line. D, voltage-dependent activation curves from oocytes injected as in C obtained from tail currents measured at −40 mV after a 70-ms pulse ranging from −50 to +105 mV in 5-mV increments from a holding potential of −80 mV. Continuous lines correspond to the sum of two Boltzmann distributions that best fit the experimental data. The curve obtained with CaV2.3 expressed alone is shown by a dotted line.
FIGURE 2.
FIGURE 2.
Short polybasic linker segment at the boundary of the GK domain slows down voltage-dependent inactivation of CaV2. 3 channels. A, schematic representation of the domain structure of the β-subunit. The highly conserved SH3 and GK domains are flanked by three variable regions, N-terminal (NT), C-terminal (CT), and the linker region joining both domains (LK). Numbers denote amino acid position of the rat β2a isoform. The two cysteine residues at positions 3 and 4 (C3C4) that undergo palmitoylation in β2a are highlighted. We divided LK into two segments, a large polyserine segment (PSLK), followed by a short polybasic segment (PBLK) at the boundary of GK domain (shown in red). Positively charged residues within PBLK are highlighted in red. B, representative current traces from Xenopus oocytes injected with CaV2.3 encoding cRNA and the indicated β-protein construct following the same protocol pulse as in Fig. 1B. β2a SH3-PBLK-GK consists of SH3 and GK domains joined by a PBLK segment, although in β2a SH3-GK no linker segment is present between both domains. The insets show anti-β antibody Western blot analysis of crude lysate from Xenopus oocytes injected with β2a SH3-PBLK-GK (left panel) or β2a SH3-GK (right panel), as described under “Experimental Procedures”; left lane, crude lysate from five noninjected oocytes; middle lane, crude lysate from five oocytes injected with the corresponding β-construct; and right lane, purified β-construct before injection (80 ng loaded). C, bar plot of average T0.5 values for oocytes expressing CaV2.3 plus the indicated β-construct. Values are expressed as means ± S.E. The dashed line corresponds to T0.5 for CaV2.3 channels expressed alone. D, voltage-dependent inactivation curves from oocytes injected with CaV2.3 encoding cRNA and the indicated β-protein measured and fitted as in Fig. 1C. The curve for CaV2.3 alone is shown by a dotted line.
FIGURE 3.
FIGURE 3.
β2a SH3-PBLK-GK located within the cytoplasm in mammalian cells. Confocal images of fluorescently labeled β2a2a-YFP), β2a SH3-PBLK-GK (β2a SH3-PBLK-GK-YFP), and β2a C3S,C4S (β2a C3S,C4S-YFP). All β2a derivatives were fused to YFP and expressed in tsA201 cells. Only β2a-YFP shows strong membrane localization, and the others are distributed within the cytoplasm.
FIGURE 4.
FIGURE 4.
Substitution of the basic residues by alanine within the polybasic linker segment eliminates slow-inactivation conferring phenotype of β2a SH3-PBLK-GK. A, schematic representation of β2a SH3-PBLK-GK showing the amino acid sequence of native PBLK and PBLK with all positively charged residues (shown in red) substituted by alanine (β2a SH3-PBLKAla-GK). The inset shows Western blot analysis using anti-β antibody of β2a SH3-PBLKAla-GK, as described under “Experimental Procedures”; left lane, crude lysate from five noninjected oocytes; middle lane, crude lysate from five oocytes injected with β2a SH3-PBLKAla-GK; and right lane, purified β2a SH3-PBLKAla-GK before injection (80 ng loaded). B, representative current traces from oocytes injected with CaV2.3 encoding cRNA and β2a SH3-PBLKAla-GK following the same protocol as in Fig. 1B. For comparison, the current recording for CaV2.3/β2a SH3-PBLK-GK channel complexes from Fig. 2B is shown in light gray. C, average T0.5 values for oocytes expressing CaV2.3/β2a SH3-PBLKAla-GK channel complexes. The dotted line denotes the average T0.5 for CaV2.3/β2a SH3-GK channels. T0.5 decreases from 0.98 ± 0.16 s for CaV2.3/β2a SH3-PBLK-GK to 0.07 ± 0.01 s for CaV2.3/β2a SH3-PBLKAla-GK channel complexes. Values are expressed as mean ± S.E. D, voltage-dependent inactivation curves from oocytes injected with CaV2.3 and β2a SH3-PBLKAla-GK obtained as in Fig. 1C. For comparison, the steady-state inactivation curve from oocytes expressing CaV2.3/β2a SH3-PBLK-GK shown in Fig. 2D is included (dotted line).
FIGURE 5.
FIGURE 5.
Polyserine linker region but not the N- or C-terminal variable sequences mask the effect of the polybasic segment on voltage-dependent inactivation. A, schematic representation of β2a C3S,C4S double mutant and representative current traces from oocytes expressing CaV2.3/β2a C3S,C4S channel complexes following the same pulse protocol as in Fig. 1B. The inset shows Western blot analysis using anti-β antibody, as described under “Experimental Procedures”; left lane, crude lysate from five noninjected Xenopus oocytes; middle lane, crude lysate from five oocytes injected with β2a C3S,C4S; and right lane, purified β2a C3S,C4S before injection (80 ng). B, same as A but using β2a SH3-PBLK-GK that includes the N-terminal region of β2a C3S,C4S (β2a SH3-PBLK-GK + NTC3S,C4S). C, same as A but using β2a SH3-PBLK-GK containing the C-terminal region of β2a2a SH3-PBLK-GK + CT). D, same as A but the β2a construct encompassing the complete linker region but missing the N-and C-terminal regions (β2a SH3-LK-GK). E, bar plot of average T0.5 values from oocytes expressing CaV2.3 plus the indicated β-derivative construct: NT, β2a SH3-PBLK-GK + NTC3S,C4S (black bar); CT, β2a SH3-PBLK-GK + CT (blue bar); LK, β2a SH3-LK-GK (red bar) and C3S,C4S, β2a C3S,C4S (green bar). The dashed line denotes average T0.5 for oocytes expressing CaV2.3/β2a SH3-PBLK-GK channel complexes. Values are expressed as mean ± S.E. F, voltage-dependent inactivation curves from oocytes expressing the different subunit combinations shown in E. For comparison, the steady-state inactivation curve from oocytes expressing CaV2.3/β2a SH3-PBLK-GK shown in Fig. 2D is included (dotted line).
FIGURE 6.
FIGURE 6.
Palmitoylated N terminus and the polybasic segment in β2a regulate synergistically voltage-dependent inactivation of CaV2.3 channels. A, schematic representation of β2a lacking the polybasic linker segment (β2a ΔPBLK) and representative current trace from oocytes injected with CaV2.3 encoding cRNA and β2a ΔPBLK following the same protocol as in Fig. 1B. For comparison, traces from oocytes expressing CaV2.3/β2a (blue) and CaV2.3/β2a C3S,C4S (gray) channel complexes from Figs. 1B and 5A, respectively, are shown. Inset corresponds to Western blot analysis using anti-β antibody, as described under “Experimental Procedures”; left lane, crude lysate from five noninjected oocytes; middle lane, crude lysate from five oocytes injected with β2a ΔPBLK, and right lane, purified β2a ΔPBLK before injection (80 ng). B, confocal image of tsA201 cells expressing β2a ΔPBLK fused to YFP, showing that removal of the PBLK does not impair membrane localization of the protein. C, average T0.5 values for CaV2.3-β2a ΔPBLK channel complexes. The dashed lines denote average T0.5 for oocytes expressing CaV2.3/β2a (blue) and CaV2.3/β2aC3S,C4S (gray) channel complexes. Values are expressed as mean ± S.E. Removal of the polybasic linker in β2a decreases T0.5 from 1.93 ± 0.47 s for CaV2.3/β2a to 1.58 ± 0.17 s for CaV2.3/β2a ΔPBLK (t test, p < 0.05), and substitution of the double cysteine motif results in faster T0.5 (0.34 ± 0.01 s for CaV2.3/β2a C3S,C4S). D, voltage-dependent inactivation curves for the same subunit combinations shown in C.
FIGURE 7.
FIGURE 7.
Model for modulation of voltage-dependent inactivation by β2a-subunit. Two molecular determinants of β-subunit control voltage-dependent inactivation as follows: palmitoylated N terminus and the polybasic linker segment (shown in “red”). The β-subunit binds through the GK domain to the conserved α-interaction domain in the CaVα1 subunit. According to current models, anchoring of β2a to the membrane restricts the movement of the inactivation particle, and based on our present data, it exposes the polybasic segment that further inhibits VDI (left panel). In the absence of a palmitoylated N terminus, the region upstream from the polybasic linker segment occludes its functional association with the inactivation machinery (right panel).

Similar articles

Cited by

References

    1. Clapham D. E. (2007) Calcium signaling. Cell 131, 1047–1058 - PubMed
    1. Carafoli E. (2002) Calcium signaling. A tale for all seasons. Proc. Natl. Acad. Sci. U.S.A. 99, 1115–1122 - PMC - PubMed
    1. Catterall W. A. (2000) Structure and regulation of voltage-gated Ca2+ channels. Annu. Rev. Cell Dev. Biol. 16, 521–555 - PubMed
    1. Cens T., Rousset M., Leyris J. P., Fesquet P., Charnet P. (2006) Voltage- and calcium-dependent inactivation in high voltage-gated Ca2+ channels. Prog. Biophys. Mol. Biol. 90, 104–117 - PubMed
    1. Liang H., DeMaria C. D., Erickson M. G., Mori M. X., Alseikhan B. A., Yue D. T. (2003) Unified mechanisms of Ca2+ regulation across the Ca2+ channel family. Neuron 39, 951–960 - PubMed

Publication types

LinkOut - more resources