. 2012 Sep 21;287(39):32640-50.
doi: 10.1074/jbc.M112.376541. Epub 2012 Jul 31.

Second generation γ-secretase modulators exhibit different modulation of Notch β and Aβ production

Affiliations

Second generation γ-secretase modulators exhibit different modulation of Notch β and Aβ production

Johanna Wanngren et al. J Biol Chem. .

Abstract

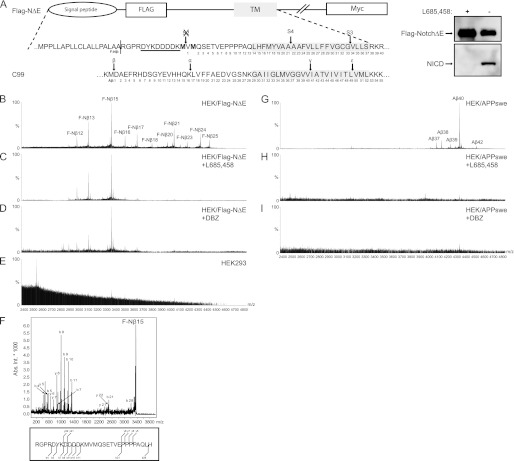
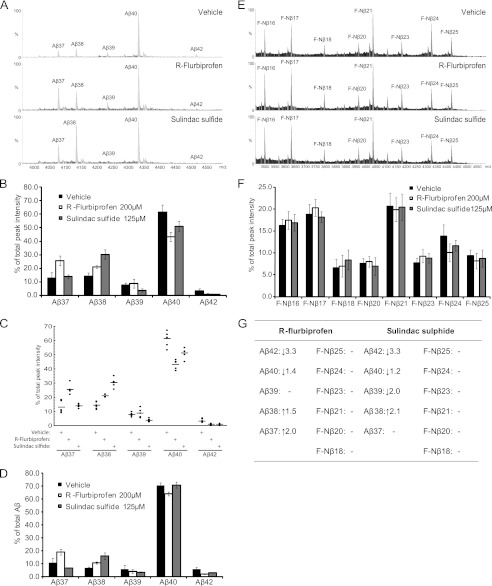
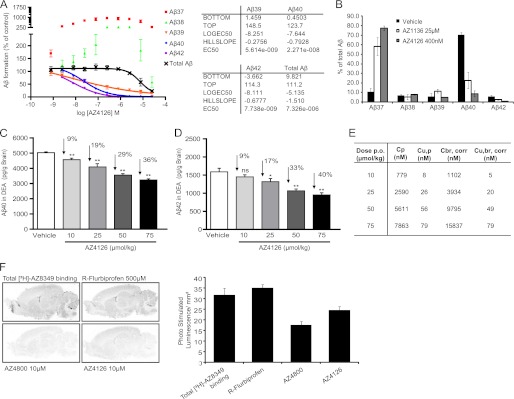
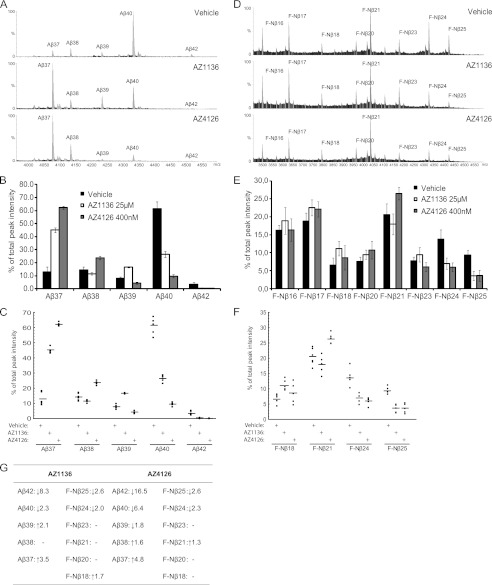
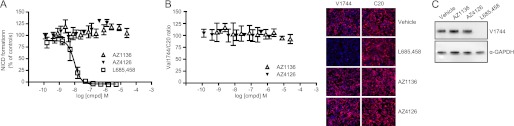
The γ-secretase complex is an appealing drug target when the therapeutic strategy is to alter amyloid-β peptide (Aβ) aggregation in Alzheimer disease. γ-Secretase is directly involved in Aβ formation and determines the pathogenic potential of Aβ by generating the aggregation-prone Aβ42 peptide. Because γ-secretase mediates cleavage of many substrates involved in cell signaling, such as the Notch receptor, it is crucial to sustain these pathways while altering the Aβ secretion. A way of avoiding interference with the physiological function of γ-secretase is to use γ-secretase modulators (GSMs) instead of inhibitors of the enzyme. GSMs modify the Aβ formation from producing the amyloid-prone Aβ42 variant to shorter and less amyloidogenic Aβ species. The modes of action of GSMs are not fully understood, and even though the pharmacology of GSMs has been thoroughly studied regarding Aβ generation, knowledge is lacking about their effects on other substrates, such as Notch. Here, using immunoprecipitation followed by MALDI-TOF MS analysis, we found that two novel, second generation GSMs modulate both Notch β and Aβ production. Moreover, by correlating S3-specific Val-1744 cleavage of Notch intracellular domain (Notch intracellular domain) to total Notch intracellular domain levels using immunocytochemistry, we also demonstrated that Notch intracellular domain is not modulated by the compounds. Interestingly, two well characterized, nonsteroidal anti-inflammatory drugs (nonsteroidal anti-inflammatory drug), R-flurbiprofen and sulindac sulfide, affect only Aβ and not Notch β formation, indicating that second generation GSMs and nonsteroidal anti-inflammatory drug-based GSMs have different modes of action regarding Notch processing.


Figures

FIGURE 1.
FIGURE 1.
Detection of secreted FLAG-Nβ and Aβ peptides. A, schematic representation of the human Notch1-ΔE protein containing an N-terminal FLAG epitope (FLAG-NΔE) to facilitate detection of the secreted FLAG-Nβ peptides. The two methionine residues depicted in bold are incorporated to prevent S2 cleavage and thus removal of the FLAG epitope. The α-FLAG antibody M2 recognition site is underlined. The part of C99 that is cleaved by β- and γ-secretase is aligned with FLAG-NΔE in respect to transmembrane domains. Arrows show the S2, S3, S4, β, α, γ, and ϵ cleavage sites, and numbering is shown for F-Nβ and Aβ. There is protein expression of HEK293 cells stably expressing human FLAG Notch1-ΔE and the generation of NICD, using a α-FLAG or the Val-1744 antibody. The NICD formation was abolished in the presence of the GSI L-685,458. B, MALDI-TOF MS spectrum of F-Nβ using conditioned medium from HEK/FLAG-NΔE cells that was immunoprecipitated with α-FLAG M2-agarose. F-Nβ numbering, using the nomenclature set by Okochi et al. (40) of the individual peaks are indicated. C and D, MALDI-TOF MS spectrum of F-Nβ using conditioned medium from HEK/FLAG-NΔE cells treated with the GSIs L-685,458 or DBZ, respectively. Spectra analysis reveals that only F-Nβ16–25 is inhibited by GSIs. E, MALDI-TOF MS spectrum of F-Nβ using conditioned medium from HEK293 cells. F, all F-Nβ peaks were identified by MS/MS, and a representative spectrum of F-Nβ15 is shown. G, MALDI-TOF MS spectrum of Aβ using 4G8 immunoprecipitated conditioned medium from HEK/APPswe cells. H and I, MALDI-TOF MS spectrum of Aβ using conditioned medium from HEK/APPswe cells treated with the GSIs L-685,458 or DBZ, respectively.
FIGURE 2.
FIGURE 2.
The effect of first generation NSAID class GSMs on Aβ and F-Nβ formation. A, MALDI-TOF MS spectrum displaying the Aβ pattern in conditioned medium from HEK/APPswe cells treated with R-flurbiprofen, sulindac sulfide, or vehicle. The intensities of the highest peak were set to 100% in the spectrum. B, Aβ peak distribution under the influence of first generation GSMs. Each Aβ peak is plotted as a percentage of total Aβ (i.e., the sum of Aβ37–42). The bars represent the means of five or six experiments with error bars indicating S.D. C, scatter plots of the Aβ peptide distribution under the influence of first generation GSMs. The data are from five or six experiments and plotted as percentages of total Aβ (i.e., the sum of Aβ37–42). D, detection of secreted Aβ peptides in conditioned medium from HEK/APPswe cells treated with R-flurbiprofen, sulindac sulfide, or vehicle by MSD technology. Aβ peptide formation is determined as a percentage of total Aβ (i.e., the sum of Aβ37–42). The bars represent the means of two experiments with error bars indicating S.D. E, MALDI-TOF MS spectrum of F-Nβ using α-FLAG immunoprecipitated conditioned medium from HEK/FLAG-NΔE cells treated with R-flurbiprofen, sulindac sulfide, or vehicle. The intensities of the highest peak were set to 100% in the spectrum. F, F-Nβ peak distribution under the influence of first generation GSMs. Because only F-Nβ16–25 could be inhibited by GSIs and not the shorter F-Nβ12–15, the latter were excluded from peak analysis. Each F-Nβ peak is plotted as a percentage of total F-Nβ (i.e., the sum of F-Nβ16–25). The bars represent the means of five or six experiments with error bars indicating S.D. G, a summary of the effect of first generation GSMs on Aβ and F-Nβ peptide formation.
FIGURE 3.
FIGURE 3.
Characterization of novel AZ second generation GSMs in vitro and in vivo. A, dose-response curve of AZ4126 displaying Aβ modulation, where Aβ formation is set relative to 0.5% Me2SO (100%) and 0.5 μm L-685,458 (0%) controls. The curve represents the means of two experiments with error bars indicating S.D. B, detection of secreted Aβ peptides in conditioned medium from HEK/APPswe cells treated with AZ1136, AZ4126, or vehicle using MSD technology. Aβ peptide formation is determined as a percentage of total Aβ (i.e., the sum of Aβ37–42). The bars represent the means of three experiments with error bars indicating S.D. C and D, AZ4126 reduces brain Aβ40 (C) and Aβ42 (D) levels in female C57BL/6 mice in a dose-dependent manner. Levels of Aβ in the brain were measured in mice 2 h after peroral administration of AZ4126 (10, 25, 50, or 75 μmol/kg) or vehicle (n = 7/group). Statistical analysis was one-way analysis of variance followed by Dunnett's multiple comparison test. *, p ≤ 0.05; **, p ≤ 0.01. E, plasma and brain exposure levels of AZ4126 in C57BL/6 mice 2 h after peroral dosing. Cp, plasma concentration; Cu,p, unbound plasma concentration; Cbr,corr, brain concentration corrected for plasma; Cu,br,corr, unbound brain concentration corrected for plasma. F, displacement of [3H] AZ8349 GSM by different GSMs on sagittal rat brain sections. 5 nm of [3H] AZ8349 was incubated in the absence or presence of 500 μm R-flurbiprofen, 10 μm of the reference compound AZ4800 (32), or 10 μm AZ4126, and the binding in the autoradiograms was quantified as optical density (photo-stimulated luminescence/mm2). AZ4126 as well as the reference compound AZ4800 displace [3H] AZ8349 but not R-flurbiprofen, indicating distinct interaction sites. The bars represent the means of two experiments with error bars indicating S.D.
FIGURE 4.
FIGURE 4.
The effect of second generation GSMs on Aβ and F-Nβ generation. A, MALDI-TOF MS spectrum of Aβ using 4G8 immunoprecipitated conditioned medium from HEK/APPswe cells treated with AZ1136, AZ4126, or vehicle. The intensities of the highest peak were set to 100% in the spectrum. B, Aβ peak distribution under the influence of second generation GSMs. Each Aβ peak is plotted as a percentage of total Aβ (i.e., the sum of Aβ37–42). The bars represent the means of five or six experiments with error bars indicating S.D. C, scatter plots of the Aβ peptide distribution under the influence of second generation GSMs. The data are from five or six experiments and plotted as percentages of total Aβ (i.e., the sum of Aβ37–42). D, MALDI-TOF MS spectrum of F-Nβ using α-FLAG immunoprecipitated conditioned medium from HEK/FLAG-NΔE cells treated with AZ1136, AZ4126, or vehicle. The intensities of the highest peak were set to 100% in the spectrum. E, F-Nβ peak distribution under the influence of second generation GSMs. We excluded F-Nβ12–15 peaks from peak analysis because they were not γ-secretase-dependent. Each F-Nβ peak is plotted as a percentage of total F-Nβ (i.e., the sum of F-Nβ16–25). The bars represent the means of five or six experiments with error bars indicating S.D. F, scatter plots of the F-Nβ18, 21, 24, and 25 peptide distributions under the influence of second generation GSMs. The data are from five or six experiments and plotted as percentages of total F-Nβ (i.e., the sum of F-Nβ16–25). G, a summary of the effect of second generation GSMs on Aβ and F-Nβ peptide formation.
FIGURE 5.
FIGURE 5.
The effect of AZ1136 and AZ4126 on NICD formation and modulation. A, in vitro cellular V1744-NICD formation assay. Neither AZ1136 nor AZ4126 inhibit NICD formation. The GSI L-685,458 serves as positive control for inhibition. The curves represent the means of three experiments with error bars indicating S.D. B, the ratio of the S3 specific V1744-NICD/total NICD is unaltered by AZ GSMs compared with vehicle, as determined by measuring the fluorescent intensity from both Val-1744 and C20 antibodies. The curves represent the means of three experiments with error bars indicating S.D. Representative immunocytochemistry images of vehicle-, L-685,458-, AZ1136-, and AZ4126-treated cells are shown. C, Western blot analysis was performed to confirm the in vitro cellular NICD formation assay. The cells were treated with AZ1136, AZ4126, or vehicle and analyzed with the Val-1744 and α-GAPDH antibodies.

Similar articles

Cited by

References

    1. Wolfe M. S. (2010) Structure, mechanism and inhibition of γ-secretase and presenilin-like proteases. Biol. Chem. 391, 839–847 - PMC - PubMed
    1. Portelius E., Tran A. J., Andreasson U., Persson R., Brinkmalm G., Zetterberg H., Blennow K., Westman-Brinkmalm A. (2007) Characterization of amyloid β peptides in cerebrospinal fluid by an automated immunoprecipitation procedure followed by mass spectrometry. J. Proteome Res. 6, 4433–4439 - PubMed
    1. Czirr E., Cottrell B. A., Leuchtenberger S., Kukar T., Ladd T. B., Esselmann H., Paul S., Schubenel R., Torpey J. W., Pietrzik C. U., Golde T. E., Wiltfang J., Baumann K., Koo E. H., Weggen S. (2008) Independent generation of Aβ42 and Aβ38 peptide species by γ-secretase. J. Biol. Chem. 283, 17049–17054 - PubMed
    1. Kakuda N., Funamoto S., Yagishita S., Takami M., Osawa S., Dohmae N., Ihara Y. (2006) Equimolar production of amyloid β-protein and amyloid precursor protein intracellular domain from β-carboxyl-terminal fragment by γ-secretase. J. Biol. Chem. 281, 14776–14786 - PubMed
    1. Qi-Takahara Y., Morishima-Kawashima M., Tanimura Y., Dolios G., Hirotani N., Horikoshi Y., Kametani F., Maeda M., Saido T. C., Wang R., Ihara Y. (2005) Longer forms of amyloid β protein. Implications for the mechanism of intramembrane cleavage by γ-secretase. J. Neurosci. 25, 436–445 - PMC - PubMed

MeSH terms

LinkOut - more resources