

High-cost imaging in elderly patients with stage IV cancer
- PMID: 22851271
- PMCID: PMC3611813
- DOI: 10.1093/jnci/djs286
High-cost imaging in elderly patients with stage IV cancer
Abstract
Background: Medicare expenditures for high-cost diagnostic imaging have risen faster than those for total cancer care and have been targeted for potential cost reduction. We sought to determine recent and long-term patterns in high-cost diagnostic imaging use among elderly (aged ≥65 years) patients with stage IV cancer.
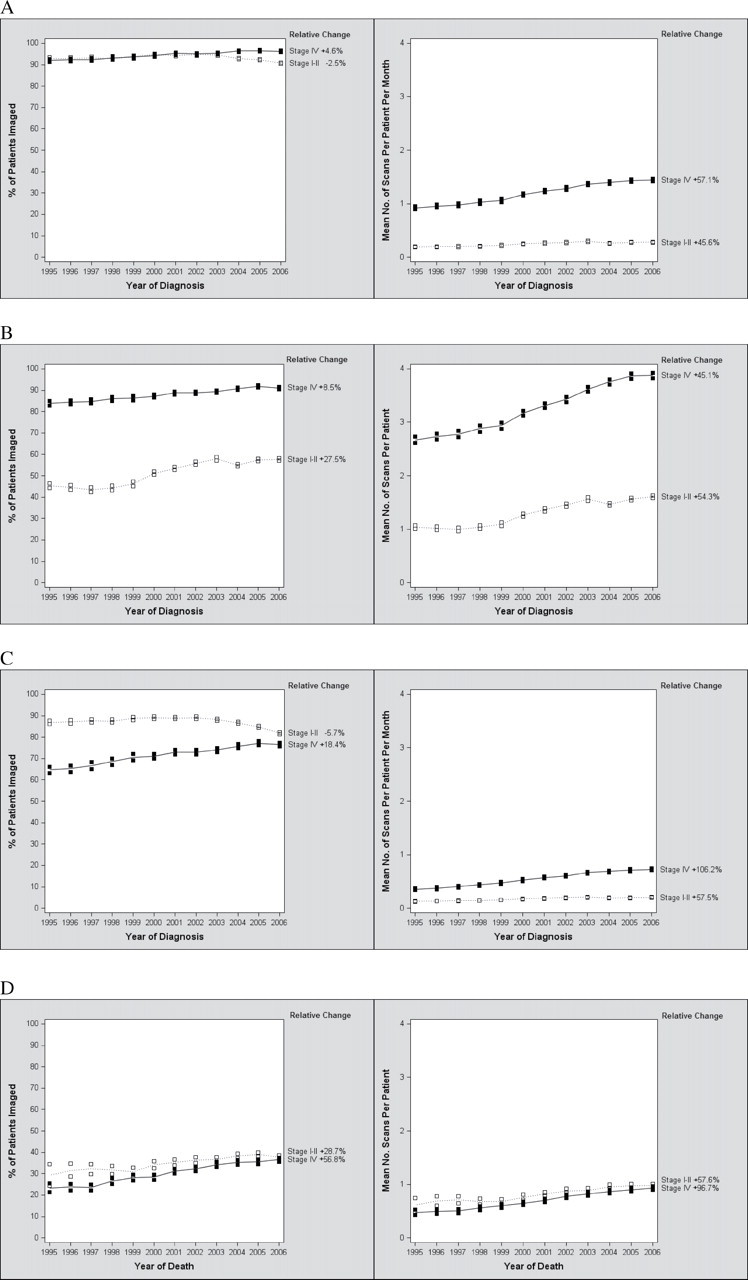
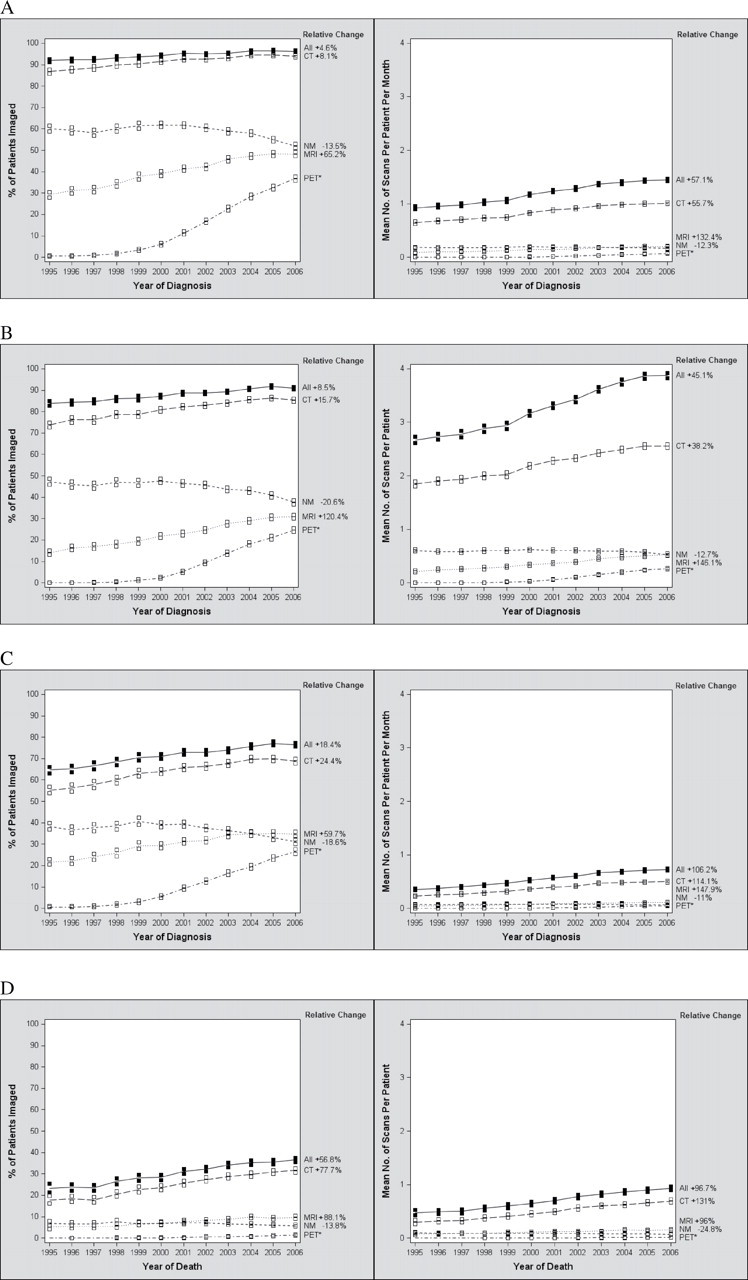
Methods: We identified claims within the Surveillance, Epidemiology, and End Results (SEER)-Medicare database with computed tomography, magnetic resonance imaging, positron emission tomography, and nuclear medicine scans between January 1994 and December 2009 for patients diagnosed with stage IV breast, colorectal, lung, or prostate cancer between January 1995 and December 2006 (N = 100,594 patients). The proportion of these patients imaged and rate of imaging per-patient per-month of survival were calculated for each phase of care in patients diagnosed between January 2002 and December 2006 (N = 55,253 patients). Logistic regression was used to estimate trends in imaging use in stage IV patients diagnosed between January 1995 and December 2006, which were compared with trends in imaging use in early-stage (stages I and II) patients with the same tumor types during the same period (N = 192,429 patients).
Results: Among the stage IV patients diagnosed between January 2002 and December 2006, 95.9% underwent a high-cost diagnostic imaging procedure, with a mean number of 9.79 (SD = 9.77) scans per patient and 1.38 (SD = 1.24) scans per-patient per-month of survival. After the diagnostic phase, 75.3% were scanned again; 34.3% of patients were scanned in the last month of life. Between January 1995 and December 2006, the proportion of stage IV cancer patients imaged increased (relative increase = 4.6%, 95% confidence interval [CI] = 3.7% to 5.6%), and the proportion of early-stage cancer patients imaged decreased (relative decrease = -2.5%, 95% CI = -3.2% to -1.9%).
Conclusions: Diagnostic imaging is used frequently in patients with stage IV disease, and its use increased more rapidly over the decade of study than that in patients with early-stage disease.
Figures
Comment in
-
High-cost imaging in elderly patients with stage IV cancer: challenges for research, policy, and practice.J Natl Cancer Inst. 2012 Aug 8;104(15):1113-4. doi: 10.1093/jnci/djs316. Epub 2012 Jul 31. J Natl Cancer Inst. 2012. PMID: 22851272 No abstract available.
References
-
- Medpac. A Data Book: Healthcare Spending and the Medicare Program Washington, DC: MPAC; 2010.
-
- NCI. Cancer Trends Progress Report—2009/2010 Update Bethesda, MD: NIH, DHHS; 2010.
-
- Meropol NJ, Schrag D, Smith TJ, et al. American Society of Clinical Oncology guidance statement: the cost of cancer care J Clin Oncol. 2009;27(23):3868–38–74 - PubMed
