Lanthanide binding and IgG affinity construct: potential applications in solution NMR, MRI, and luminescence microscopy
- PMID: 22851279
- PMCID: PMC3526988
- DOI: 10.1002/pro.2133
Lanthanide binding and IgG affinity construct: potential applications in solution NMR, MRI, and luminescence microscopy
Abstract
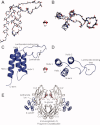
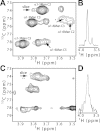
Paramagnetic lanthanide ions when bound to proteins offer great potential for structural investigations that utilize solution nuclear magnetic resonance spectroscopy, magnetic resonance imaging, or optical microscopy. However, many proteins do not have native metal ion binding sites and engineering a chimeric protein to bind an ion while retaining affinity for a protein of interest represents a significant challenge. Here we report the characterization of an immunoglobulin G-binding protein redesigned to include a lanthanide binding motif in place of a loop between two helices (Z-L2LBT). It was shown to bind Tb³⁺ with 130 nM affinity. Ions such as Dy³⁺, Yb³⁺, and Ce³⁺ produce paramagnetic effects on NMR spectra and the utility of these effects is illustrated by their use in determining a structural model of the metal-complexed Z-L2LBT protein and a preliminary characterization of the dynamic distribution of IgG Fc glycan positions. Furthermore, this designed protein is demonstrated to be a novel IgG-binding reagent for magnetic resonance imaging (Z-L2LBT:Gd³⁺ complex) and luminescence microscopy (Z-L2LBT: Tb³⁺ complex).
Copyright © 2012 The Protein Society.
Figures


Similar articles
-
An encodable lanthanide binding tag with reduced size and flexibility for measuring residual dipolar couplings and pseudocontact shifts in large proteins.J Biomol NMR. 2016 Jan;64(1):75-85. doi: 10.1007/s10858-015-0009-6. Epub 2016 Jan 4. J Biomol NMR. 2016. PMID: 26728077 Free PMC article.
-
Isoquinoline-based lanthanide complexes: bright NIR optical probes and efficient MRI agents.Inorg Chem. 2012 Feb 20;51(4):2522-32. doi: 10.1021/ic202446e. Epub 2012 Jan 10. Inorg Chem. 2012. PMID: 22233349
-
The mechanism of binding staphylococcal protein A to immunoglobin G does not involve helix unwinding.Biochemistry. 1996 Jan 9;35(1):22-31. doi: 10.1021/bi9512814. Biochemistry. 1996. PMID: 8555177
-
Spectroscopic investigations of lanthanide ion binding to nucleic acids.Met Ions Life Sci. 2012;10:171-99. doi: 10.1007/978-94-007-2172-2_6. Met Ions Life Sci. 2012. PMID: 22210339 Review.
-
Development of responsive lanthanide-based magnetic resonance imaging and luminescent probes for biological applications.Chem Pharm Bull (Tokyo). 2010 Oct;58(10):1283-94. doi: 10.1248/cpb.58.1283. Chem Pharm Bull (Tokyo). 2010. PMID: 20930392 Review.
Cited by
-
Paramagnetic NMR in drug discovery.J Biomol NMR. 2020 Jul;74(6-7):287-309. doi: 10.1007/s10858-020-00322-0. Epub 2020 Jun 10. J Biomol NMR. 2020. PMID: 32524233 Free PMC article. Review.
-
NMR analysis suggests the terminal domains of Robo1 remain extended but are rigidified in the presence of heparan sulfate.Sci Rep. 2022 Aug 30;12(1):14769. doi: 10.1038/s41598-022-18769-6. Sci Rep. 2022. PMID: 36042257 Free PMC article.
-
Sparse labeling of proteins: structural characterization from long range constraints.J Magn Reson. 2014 Apr;241:32-40. doi: 10.1016/j.jmr.2013.12.012. J Magn Reson. 2014. PMID: 24656078 Free PMC article. Review.
-
The Preparation and Solution NMR Spectroscopy of Human Glycoproteins Is Accessible and Rewarding.Methods Enzymol. 2019;614:239-261. doi: 10.1016/bs.mie.2018.08.021. Epub 2018 Sep 22. Methods Enzymol. 2019. PMID: 30611426 Free PMC article.
-
An encodable lanthanide binding tag with reduced size and flexibility for measuring residual dipolar couplings and pseudocontact shifts in large proteins.J Biomol NMR. 2016 Jan;64(1):75-85. doi: 10.1007/s10858-015-0009-6. Epub 2016 Jan 4. J Biomol NMR. 2016. PMID: 26728077 Free PMC article.
References
-
- Otting G. Prospects for lanthanides in structural biology by NMR. J Biomol NMR. 2008;42:1–9. - PubMed
-
- Gordon-Grossman M, Kaminker I, Gofman Y, Shai Y, Goldfarb D. W-Band pulse EPR distance measurements in peptides using Gd(3+)-dipicolinic acid derivatives as spin labels. Phys Chem Chem Phys. 2011;13:10771–10780. - PubMed
-
- Yagi H, Banerjee D, Graham B, Huber T, Goldfarb D, Otting G. Gadolinium tagging for high-precision measurements of 6 nm distances in protein assemblies by EPR. J Am Chem Soc. 2011;133:10418–10421. - PubMed
-
- Laurent S, Vander Elst L, Muller RN. Lanthanide complexes for magnetic resonance and optical molecular imaging. Q J Nucl Med Mol Imaging. 2009;53:586–603. - PubMed
-
- Silvaggi NR, Martin LJ, Schwalbe H, Imperiali B, Allen KN. Double-lanthanide-binding tags for macromolecular crystallographic structure determination. J Am Chem Soc. 2007;129:7114–7120. - PubMed
Publication types
MeSH terms
Substances
Grants and funding
LinkOut - more resources
Full Text Sources

