. 2013 Jul;70(1):33-9.
doi: 10.1002/mrm.24434. Epub 2012 Jul 31.

Evaluation of heterogeneous metabolic profile in an orthotopic human glioblastoma xenograft model using compressed sensing hyperpolarized 3D 13C magnetic resonance spectroscopic imaging

Affiliations

Evaluation of heterogeneous metabolic profile in an orthotopic human glioblastoma xenograft model using compressed sensing hyperpolarized 3D 13C magnetic resonance spectroscopic imaging

Ilwoo Park et al. Magn Reson Med. 2013 Jul.

Abstract

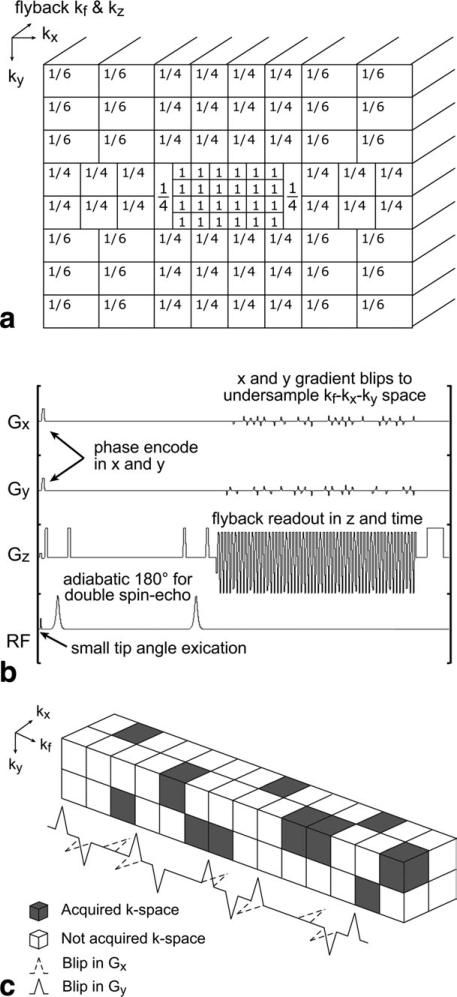
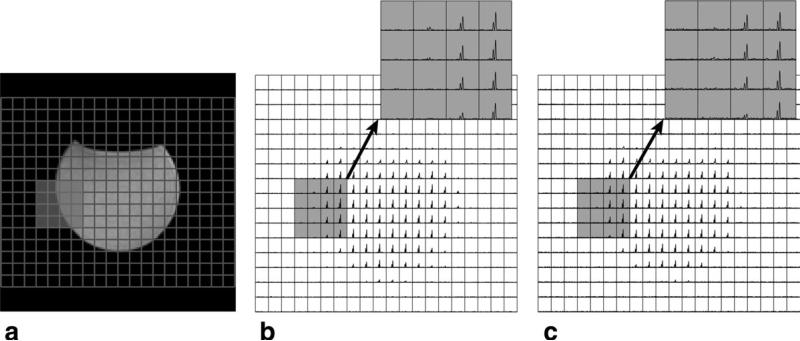
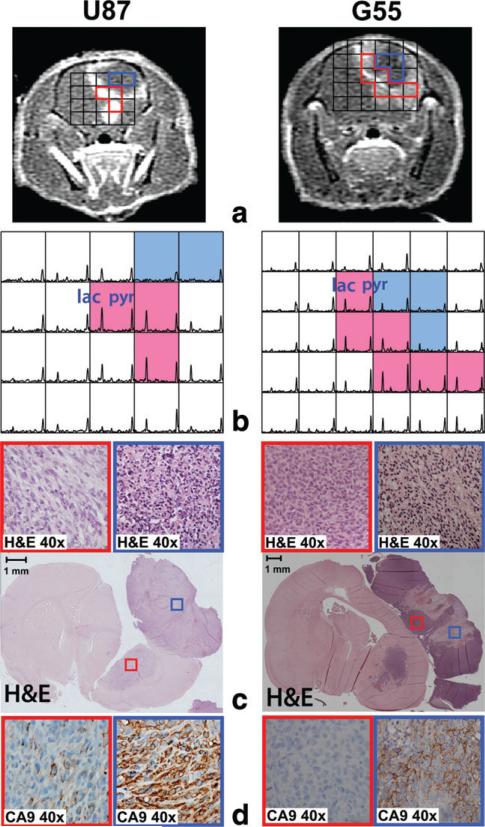
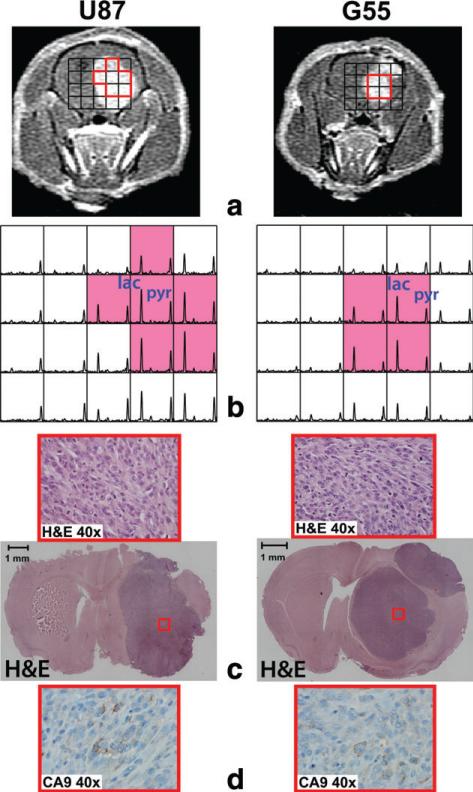
High resolution compressed sensing hyperpolarized (13)C magnetic resonance spectroscopic imaging was applied in orthotopic human glioblastoma xenografts for quantitative assessment of spatial variations in (13)C metabolic profiles and comparison with histopathology. A new compressed sensing sampling design with a factor of 3.72 acceleration was implemented to enable a factor of 4 increase in spatial resolution. Compressed sensing 3D (13)C magnetic resonance spectroscopic imaging data were acquired from a phantom and 10 tumor-bearing rats following injection of hyperpolarized [1-(13)C]-pyruvate using a 3T scanner. The (13)C metabolic profiles were compared with hematoxylin and eosin staining and carbonic anhydrase 9 staining. The high-resolution compressed sensing (13)C magnetic resonance spectroscopic imaging data enabled the differentiation of distinct (13)C metabolite patterns within abnormal tissues with high specificity in similar scan times compared to the fully sampled method. The results from pathology confirmed the different characteristics of (13)C metabolic profiles between viable, non-necrotic, nonhypoxic tumor, and necrotic, hypoxic tissue.


Figures

FIG. 1
FIG. 1
An undersampling pattern for the new compressed sensing scheme (a) and pulse sequence timing diagram for compressed sensing 13C MRSI (b). The numbers in (a) represent the fraction of samples collected in each kx-ky-kf block. c: Illustration of random undersampling in kx-ky-kf space. Random undersampling was achieved by implementing blips in the x and y gradients.
FIG. 2
FIG. 2
An anatomical image of a phantom (a) and 13C spectra acquired using the new compressed sensing design (b) and fully sampled method (c). The compressed sensing reconstructed data produced 13C acetate signal with high spectral quality and matched the fully sampled data.
FIG. 3
FIG. 3
Compressed sensing (b) and fully sampled (c) 13C 3D MRSI data acquired in successive scans. T1 post-Gd images corresponding to the location of 13C spectra are shown in (a). The overall profiles of pyruvate and lactate were consistent between the two methods. The light grey voxels represent 13C spectra from tumor tissue. The dark grey voxels contained high pyruvate signal from blood vessels, which were used to normalize lactate, pyruvate, and total carbon levels.
FIG. 4
FIG. 4
An example of two rats with heterogeneous tumors showing T1 post-Gd images (a), 13C spectra (b) and histopathology (c, d). The voxels representing necrosis (blue voxels in b) and contrast enhancement (red voxels in b) exhibited distinct 13C metabolic profiles from the compressed sensing data. Hematoxylin and eosin staining and CA9 immunostaining demonstrated substantial necrosis and hypoxia (blue boxes in c and d) in the area with small pyruvate and lactate (blue voxels in b) while the area with high 13C metabolites (red voxels in b) consisted of viable tumor with minimal or no necrosis and hypoxia (red boxes in c and d).
FIG. 5
FIG. 5
An example of two rats with a uniform CE lesion showing T1 post-Gd images (a), 13C spectra (b), and histopathology (c, d). Compressed sensing 13C spectra displayed highly elevated pyruvate and lactate consistently across the contrast enhancement voxel (red voxels in b). The corresponding hematoxylin and eosin staining and CA9 slides showed viable tumor without substantial necrosis and hypoxia (red boxes in c and d).

References

    1. Ardenkjaer-Larsen JH, Fridlund B, Gram A, Hansson G, Hansson L, Lerche MH, Servin R, Thaning M, Golman K. Increase in signal-to-noise ratio of >10,000 times in liquid-state NMR. Proc Natl Acad Sci USA. 2003;100:10158–10163. - PMC - PubMed
    1. Park I, Larson PE, Zierhut ML, et al. Hyperpolarized 13C magnetic resonance metabolic imaging: application to brain tumors. Neuro Oncol. 2010;12:133–144. - PMC - PubMed
    1. Park I, Bok R, Ozawa T, Phillips JJ, James CD, Vigneron DB, Ronen SM, Nelson SJ. Detection of early response to temozolomide treatment in brain tumors using hyperpolarized 13C MR metabolic imaging. J Magn Reson Imaging. 2011;33:1284–1290. - PMC - PubMed
    1. Chaumeil MM, Ozawa T, Park I, Scott K, James CD, Nelson SJ, Ronen SM. Hyperpolarized (13)C MR spectroscopic imaging can be used to monitor Everolimus treatment in vivo in an orthotopic rodent model of glioblastoma. Neuroimage. 2012;59:193–201. - PMC - PubMed
    1. Hu S, Lustig M, Balakrishnan A, et al. 3D compressed sensing for highly accelerated hyperpolarized 13C MRSI with in vivo applications to transgenic mouse models of cancer. Magn Reson Med. 2010;63:312–321. - PMC - PubMed

Publication types