. 2012 Oct;97(10):E1880-9.
doi: 10.1210/jc.2012-1670. Epub 2012 Jul 31.

Increased tenascin C and Toll-like receptor 4 levels in visceral adipose tissue as a link between inflammation and extracellular matrix remodeling in obesity

Affiliations

Increased tenascin C and Toll-like receptor 4 levels in visceral adipose tissue as a link between inflammation and extracellular matrix remodeling in obesity

Victoria Catalán et al. J Clin Endocrinol Metab. 2012 Oct.

Abstract

Context: Obesity is associated with an altered inflammatory and extracellular matrix (ECM) profile. Tenascin C (TNC) is an ECM glycoprotein with proinflammatory effects.

Objective: We aimed to explore the expression levels of TNC in adipose tissue analyzing the contribution of adipocytes and stromovascular fraction cells (SVFC) as well as its impact on inflammation and ECM regulation. We also analyzed the effect of the stimulation with TNF-α and lipopolysaccharide (LPS) on both SVFC and adipocytes.

Patients and methods: Samples obtained from 75 subjects were used in the study. Expression levels of TNC, TLR4, MMP2, and MMP9 were analyzed in visceral adipose tissue (VAT) as well as in both adipocytes and SVFC. In addition, Tnc expression was measured in two mice models of obesity.

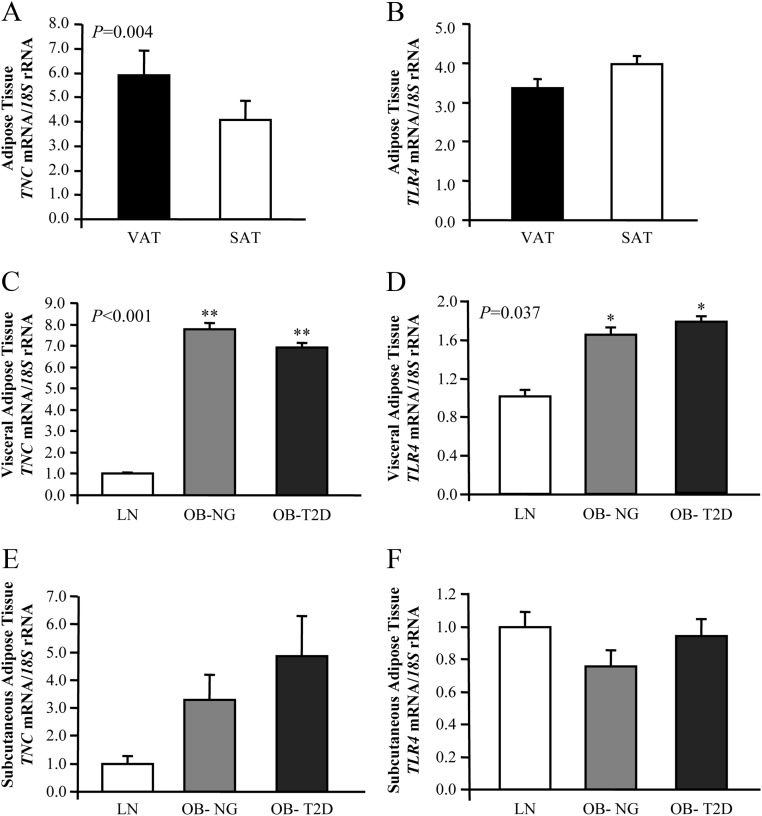
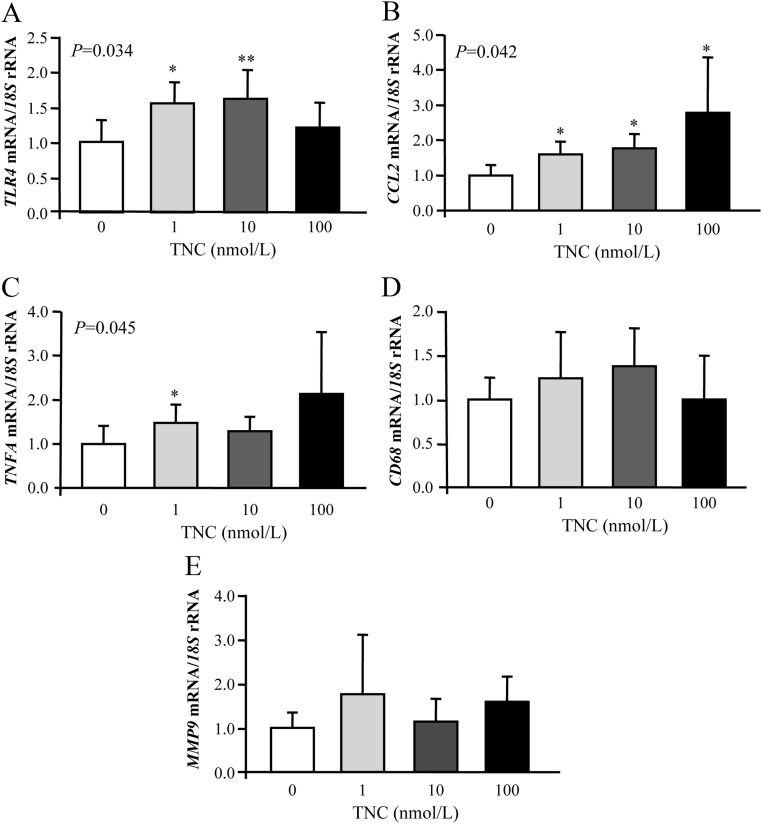
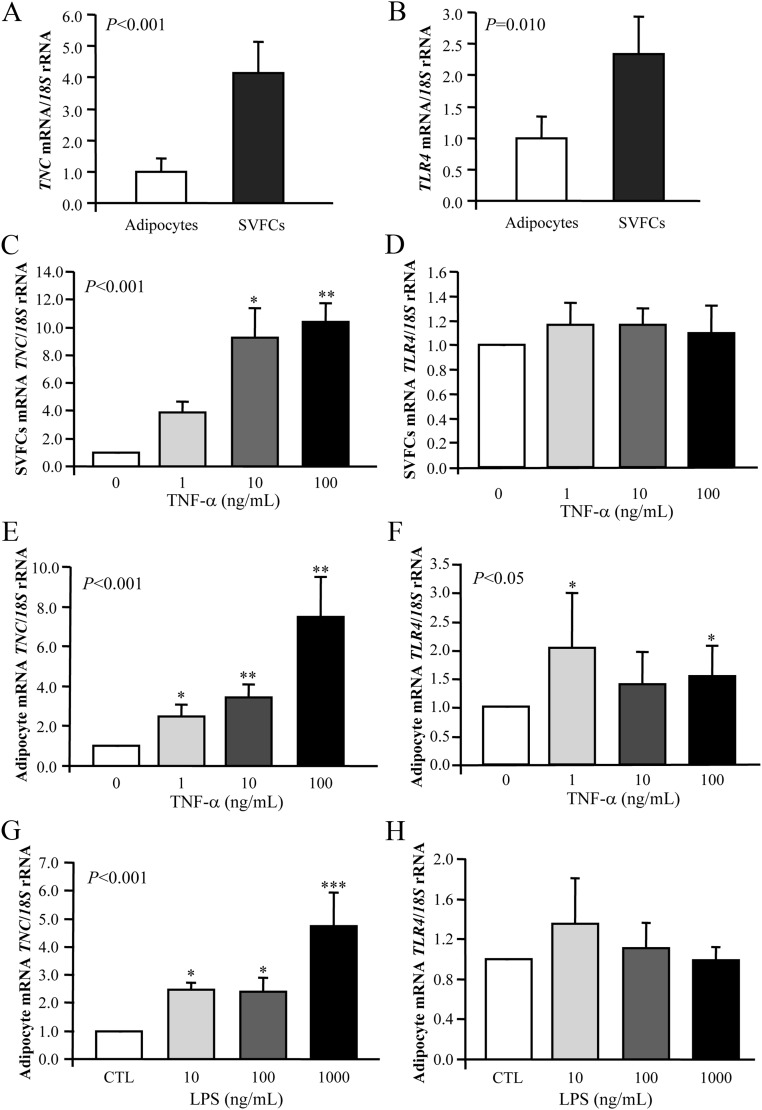
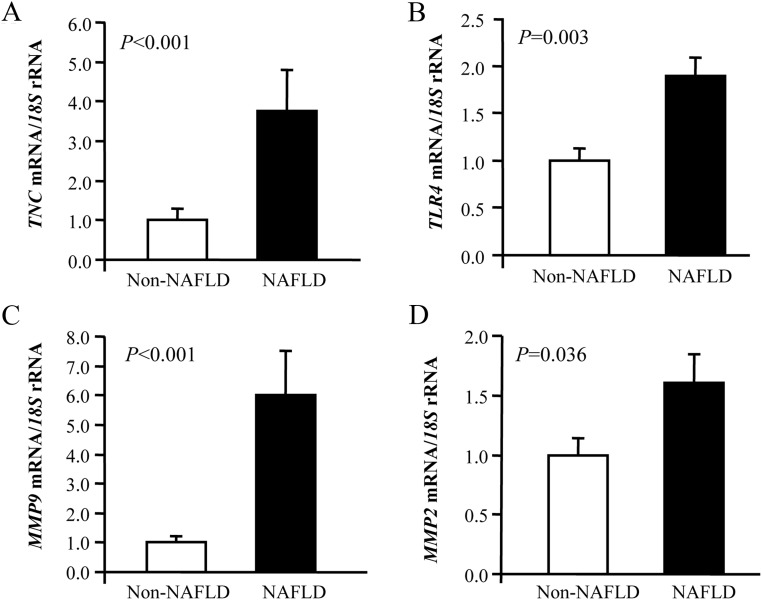
Results: We show, for the first time, that VAT expression levels of TNC are increased in normoglycemic and type 2 diabetic obese patients (P<0.01) as well as in obese patients with nonalcoholic steatohepatitis (P<0.01). Furthermore, expression levels of Tnc in epididymal adipose tissue from two different mice models of obesity were significantly increased (P<0.01). TNC and TLR4 were mainly expressed by SVFC, and its expression was significantly enhanced (P<0.01) by TNF-α treatment. LPS treatment also increased mRNA levels of TNC. Moreover, the addition of exogenous TNC induced (P<0.05) TLR4 and CCL2 mRNA expression in human adipocyte cultures.

Conclusions: These findings indicate that TNC is involved in the etiopathology of obesity via visceral adipose tissue inflammation representing a link with ECM remodeling.


Figures

Fig. 1.
Fig. 1.
Impact of obesity and obesity-associated T2D on gene expression levels of TNC and TLR4 in adipose tissue. A and B, Analysis of mRNA levels of TNC and TLR4 in VAT and SAT (VAT: n = 75; SAT: n = 23). Bars represent the mean ± sd of the ratio between the gene expression to 18S rRNA. Differences between groups were analyzed by a two-tailed unpaired Student's t test. C and D, Gene expression levels of TNC and TRL4 in VAT of LN, obese NG, and obese T2D volunteers (LN: n = 13; OB-NG: n = 32; OB-T2D: n = 30). E and F, Gene expression levels of TNC and TRL4 in SAT of LN, obese NG, and obese T2D volunteers (LN: n = 7; OB-NG: n = 7; OB-T2D: n = 9). Bars represent the mean ± sd of the ratio between the gene expression to 18S rRNA. The expression level in LN subjects was assumed to be 1. Differences between groups were analyzed by one-way ANOVA followed by Tukey's tests. *, P < 0.05, **, P < 0.01 vs. LN.
Fig. 2.
Fig. 2.
Gene expression levels of TLR4 (A), chemokine (C-C motif) ligand 2 (CCL2) (B), TNFA (C), CD68 antigen (CD68) (D), and MMP9 (E) in human visceral adipocytes stimulated with recombinant TNC (1.0–100 nmol/liter) for 24 h. Gene expression levels in the unstimulated cells were assumed to be 1. Values are the mean ± sd (n = 6 per group). Differences between groups were analyzed by one-way ANOVA followed by Tukey's tests. *, P < 0.05 and **, P < 0.01 vs. unstimulated cells.
Fig. 3.
Fig. 3.
Gene expression levels of TNC and TLR4 in human visceral adipocytes and SVFC. A and B, Comparison of TNC and TLR4 gene expression in adipocytes and SVFC isolated from VAT of obese patients. Bars represent the mean ± sd of the ratio between the gene expression to 18S rRNA. The expression level in adipocytes was assumed to be 1 (adipocytes: n = 9; SVFC: n = 11). Statistical differences were assessed by a two-tailed unpaired Student's t test. *, P < 0.05, **, P < 0.01 vs. adipocytes. C and D, Effect of TNF-α. Bar graphs show the effect of TNF-α incubated for 24 h on the transcript levels of TNC and TLR4 in visceral SVFC. E and F, Transcript levels of TNC and TLR4 after 24 h incubation with TNF-α in visceral adipocytes. G and H, Gene expression levels of TNC and TLR4 in human visceral adipocytes after LPS treatment. The gene expression levels in the unstimulated cells were assumed to be 1. Values are the mean ± sd (n = 6 per group). Differences between groups were analyzed by one-way ANOVA followed by Tukey's tests. CTL, Control. *, P < 0.05; ***, P < 0.01 vs. unstimulated cells.
Fig. 4.
Fig. 4.
Gene expression levels of TNC (A), TLR4 (B), MMP9 (C), and MMP2 (D) in the VAT of obese patients with and without NAFLD. Bars represent the mean ± sd of the ratio between the gene expression to 18S rRNA. The expression level in non-NAFLD subjects was assumed to be 1 (non-NAFLD: n = 18; NAFLD: n = 25). Differences between groups were assessed by two-tailed unpaired Student's t test.

References

    1. Rutkowski JM, Davis KE, Scherer PE. 2009. Mechanisms of obesity and related pathologies: the macro- and microcirculation of adipose tissue. FEBS J 276:5738–5746 - PMC - PubMed
    1. Mariman EC, Wang P. 2010. Adipocyte extracellular matrix composition, dynamics and role in obesity. Cell Mol Life Sci 67:1277–1292 - PMC - PubMed
    1. Krakoff J. 2012. The platform for adipose tissue expansion during positive energy balance. J Clin Endocrinol Metab 97:377–379 - PMC - PubMed
    1. Gómez-Ambrosi J, Salvador J, Rotellar F, Silva C, Catalán V, Rodríguez A, Jésus Gil MJ, Frühbeck G. 2006. Increased serum amyloid A concentrations in morbid obesity decrease after gastric bypass. Obes Surg 16:262–269 - PubMed
    1. Divoux A, Clément K. 2011. Architecture and the extracellular matrix: the still unappreciated components of the adipose tissue. Obes Rev 12:e494–e503 - PubMed

Publication types

MeSH terms