

Increased inner ear susceptibility to noise injury in mice with streptozotocin-induced diabetes
- PMID: 22851574
- PMCID: PMC3478526
- DOI: 10.2337/db11-1845
Increased inner ear susceptibility to noise injury in mice with streptozotocin-induced diabetes
Abstract
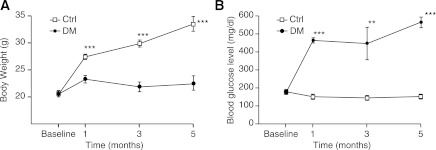
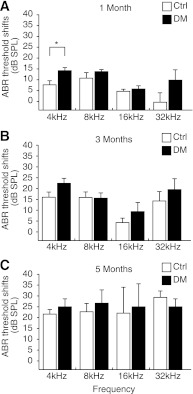
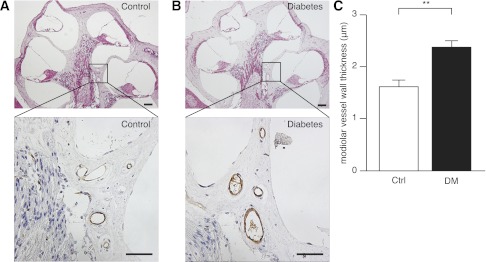
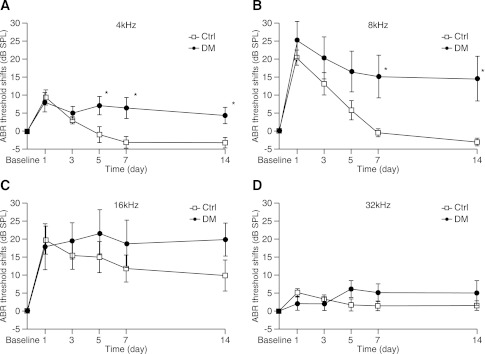
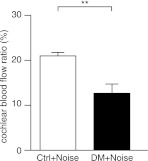
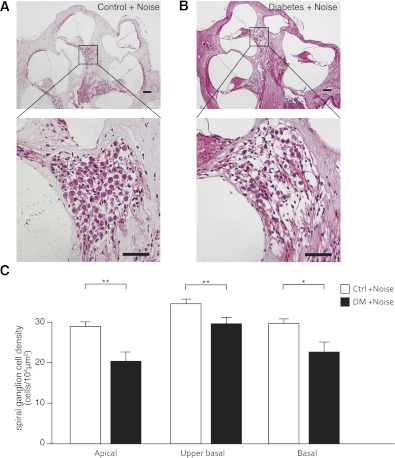
We aimed to investigate the pathophysiology of diabetes-associated hearing impairment in type 1 diabetes using mice with streptozotocin-induced diabetes (C57BL/6J; male). Hearing function was evaluated 1, 3, and 5 months after induction of diabetes (five diabetic and five control animals per time point) using auditory-evoked brain stem responses (ABRs). Mice (four diabetic and four control) were exposed to loud noise (105 dB) 5 months after induction of diabetes. ABRs were measured before and after noise exposure. Cochlear blood flows were measured by laser-Doppler flowmeter. Spiral ganglion cells (SGCs) were counted. Vessel endothelial cells were observed by CD31 immunostaining. Chronologic changes in the ABR threshold shift were not significantly different between the diabetic and control groups. However, vessel walls in the modiolus of the cochleae were significantly thicker in the diabetic group than the control group. Additionally, recovery from noise-induced injury was significantly impaired in diabetic mice. Reduced cochlea blood flows and SGC loss were observed in diabetic mice cochleae after noise exposure. Our data suggest that diabetic cochleae are more susceptible than controls to loud noise exposure, and decreased cochlear blood flow due to sclerosis of the vessels and consequent loss of SGCs are possible mechanisms of hearing impairment in diabetic patients.
Figures
Similar articles
-
Low Iron Diet Increases Susceptibility to Noise-Induced Hearing Loss in Young Rats.Nutrients. 2016 Jul 28;8(8):456. doi: 10.3390/nu8080456. Nutrients. 2016. Retraction in: Nutrients. 2017 Apr 25;9(4):E422. doi: 10.3390/nu9040422. PMID: 27483303 Free PMC article. Retracted.
-
Adenosine receptors regulate susceptibility to noise-induced neural injury in the mouse cochlea and hearing loss.Hear Res. 2017 Mar;345:43-51. doi: 10.1016/j.heares.2016.12.015. Epub 2016 Dec 26. Hear Res. 2017. PMID: 28034618
-
Noise induced reversible changes of cochlear ribbon synapses contribute to temporary hearing loss in mice.Acta Otolaryngol. 2015;135(11):1093-102. doi: 10.3109/00016489.2015.1061699. Epub 2015 Jul 3. Acta Otolaryngol. 2015. PMID: 26139555
-
Genetic influences on susceptibility of the auditory system to aging and environmental factors.Scand Audiol Suppl. 1992;36:1-39. Scand Audiol Suppl. 1992. PMID: 1488615 Review.
-
Physiopathology of the cochlear microcirculation.Hear Res. 2011 Dec;282(1-2):10-24. doi: 10.1016/j.heares.2011.08.006. Epub 2011 Aug 23. Hear Res. 2011. PMID: 21875658 Free PMC article. Review.
Cited by
-
Susceptibility of Diabetic Mice to Noise Trauma.Biomed Res Int. 2018 Feb 12;2018:7601232. doi: 10.1155/2018/7601232. eCollection 2018. Biomed Res Int. 2018. PMID: 29619376 Free PMC article.
-
A high-fat diet delays age-related hearing loss progression in C57BL/6J mice.PLoS One. 2015 Jan 27;10(1):e0117547. doi: 10.1371/journal.pone.0117547. eCollection 2015. PLoS One. 2015. PMID: 25625852 Free PMC article.
-
Investigation of the Ototoxic Effect of Pembrolizumab Using a Rat Model.Cureus. 2019 Nov 2;11(11):e6057. doi: 10.7759/cureus.6057. Cureus. 2019. PMID: 31827988 Free PMC article.
-
Noise-Induced Hearing Loss: Updates on Molecular Targets and Potential Interventions.Neural Plast. 2021 Jul 6;2021:4784385. doi: 10.1155/2021/4784385. eCollection 2021. Neural Plast. 2021. PMID: 34306060 Free PMC article. Review.
-
Acoustic Trauma Modulates Cochlear Blood Flow and Vasoactive Factors in a Rodent Model of Noise-Induced Hearing Loss.Int J Mol Sci. 2019 Oct 25;20(21):5316. doi: 10.3390/ijms20215316. Int J Mol Sci. 2019. PMID: 31731459 Free PMC article.
References
-
- Tucci D, Merson MH, Wilson BS. A summary of the literature on global hearing impairment: current status and priorities for action. Otol Neurotol 2010;31:31–41 - PubMed
-
- Bagai A, Thavendiranathan P, Detsky AS. Does this patient have hearing impairment? JAMA 2006;295:416–428 - PubMed
-
- Gates GA, Mills JH. Presbycusis. Lancet 2005;366:1111–1120 - PubMed
-
- Jordao AMD. Consideration sur un cas du diabete. Union Medicale du Paris 1857;11:446
-
- Cullen JR, Cinnamond MJ. Hearing loss in diabetics. J Laryngol Otol 1993;107:179–182 - PubMed
Publication types
MeSH terms
Substances
LinkOut - more resources
Full Text Sources
Medical
Miscellaneous
