. 2012 Oct;192(2):651-69.
doi: 10.1534/genetics.112.139519. Epub 2012 Jul 30.

A maximum-likelihood method to correct for allelic dropout in microsatellite data with no replicate genotypes

Affiliations

A maximum-likelihood method to correct for allelic dropout in microsatellite data with no replicate genotypes

Chaolong Wang et al. Genetics. 2012 Oct.

Abstract

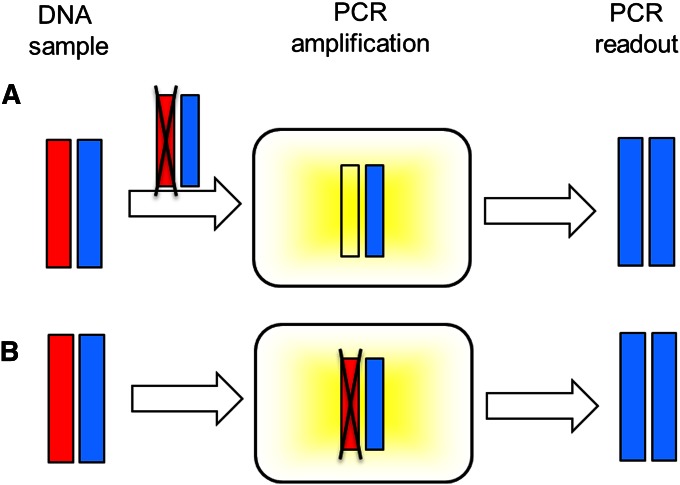
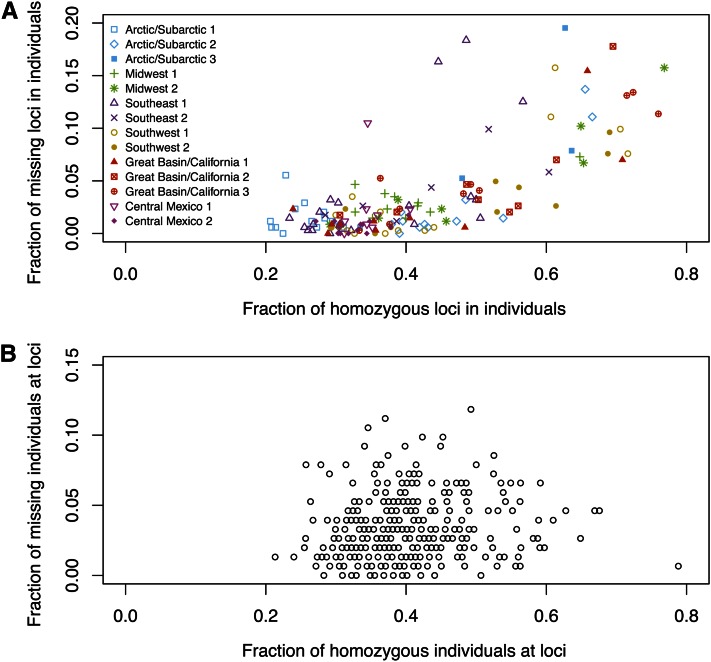
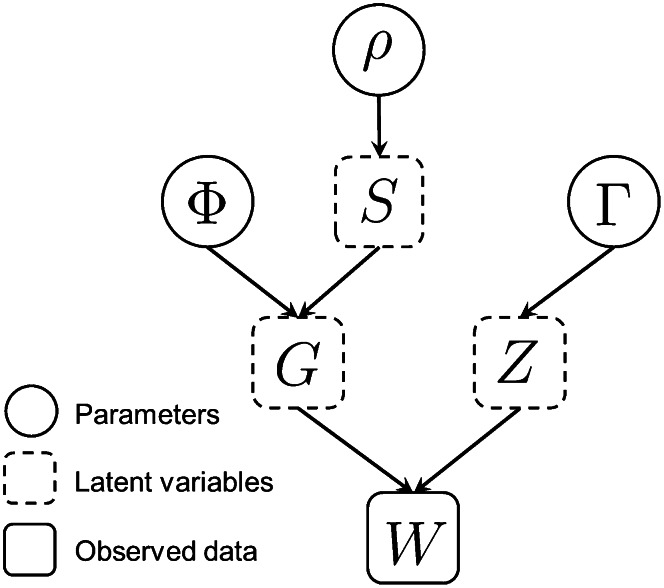
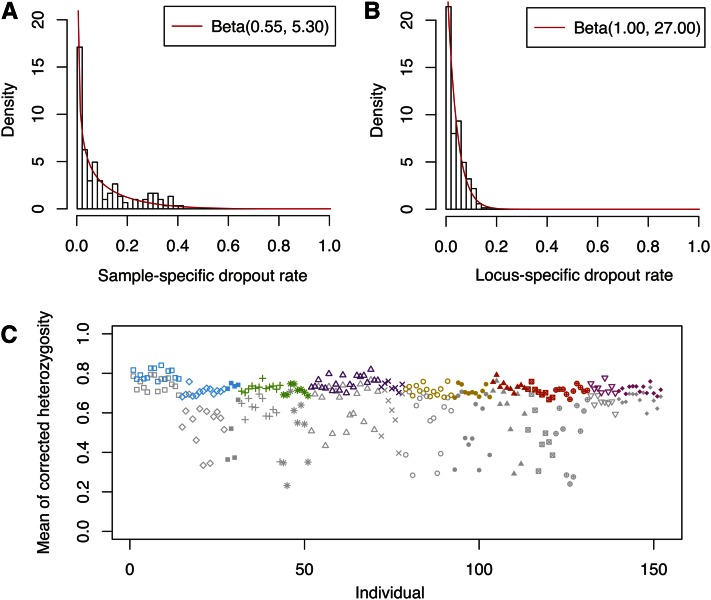
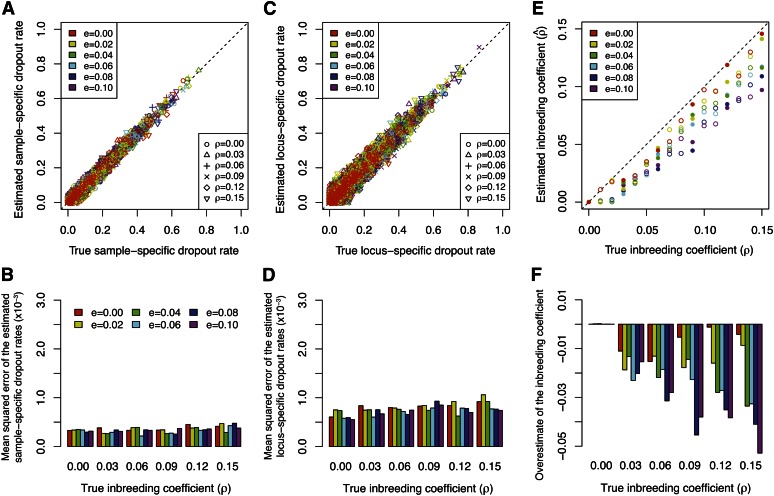
Allelic dropout is a commonly observed source of missing data in microsatellite genotypes, in which one or both allelic copies at a locus fail to be amplified by the polymerase chain reaction. Especially for samples with poor DNA quality, this problem causes a downward bias in estimates of observed heterozygosity and an upward bias in estimates of inbreeding, owing to mistaken classifications of heterozygotes as homozygotes when one of the two copies drops out. One general approach for avoiding allelic dropout involves repeated genotyping of homozygous loci to minimize the effects of experimental error. Existing computational alternatives often require replicate genotyping as well. These approaches, however, are costly and are suitable only when enough DNA is available for repeated genotyping. In this study, we propose a maximum-likelihood approach together with an expectation-maximization algorithm to jointly estimate allelic dropout rates and allele frequencies when only one set of nonreplicated genotypes is available. Our method considers estimates of allelic dropout caused by both sample-specific factors and locus-specific factors, and it allows for deviation from Hardy-Weinberg equilibrium owing to inbreeding. Using the estimated parameters, we correct the bias in the estimation of observed heterozygosity through the use of multiple imputations of alleles in cases where dropout might have occurred. With simulated data, we show that our method can (1) effectively reproduce patterns of missing data and heterozygosity observed in real data; (2) correctly estimate model parameters, including sample-specific dropout rates, locus-specific dropout rates, and the inbreeding coefficient; and (3) successfully correct the downward bias in estimating the observed heterozygosity. We find that our method is fairly robust to violations of model assumptions caused by population structure and by genotyping errors from sources other than allelic dropout. Because the data sets imputed under our model can be investigated in additional subsequent analyses, our method will be useful for preparing data for applications in diverse contexts in population genetics and molecular ecology.


Figures

Figure 1
Figure 1
Two stages of allelic dropout. The red and blue bars are two allelic copies of a locus in a DNA sample. The black X indicates the location at which allelic dropout occurs. (A) Owing to sample-specific factors such as low DNA concentration or poor DNA quality, one of the two alleles drops out when preparing DNA for PCR amplification. (B) Owing to either locus-specific factors such as low binding affinity between primers or polymerase and the target DNA sequences or sample-specific factors such as poor DNA quality, one of the two alleles fails to amplify with PCR. In both examples shown, allelic dropout results in an erroneous PCR readout of a homozygous genotype.
Figure 2
Figure 2
Fraction of observed missing data vs. fraction of observed homozygotes. (A) Each symbol represents an individual with fraction x of its nonmissing loci observed as homozygous and fraction y of its total loci observed to have both copies missing. The Pearson correlation between X and Y is r = 0.729 (P < 0.0001, by 10,000 permutations of X while fixing Y). (B) Each circle represents a locus at which fraction x of individuals with nonmissing genotypes are observed to be homozygotes and fraction y of all individuals are observed to have both copies missing. r = 0.099 (P = 0.0326).
Figure 3
Figure 3
Graphical representation of the model. Each arrow denotes a dependency between two sets of quantities: Φ allele frequencies; ρ, inbreeding coefficient; Γ, sample-specific and locus-specific dropout rates; G, true genotypes; S, IBD states; Z, dropout states; and W, observed genotypes. W is the only observed data, consisting of N × L independent observations and providing information to infer parameters Φ, ρ, and Γ.
Figure 4
Figure 4
Estimated dropout rates and corrected heterozygosity for the Native American data. (A) Histogram of the estimated sample-specific dropout rates. The histogram is fitted by a beta distribution with parameters estimated using the method of moments. (B) Histogram of the estimated locus-specific dropout rates. The histogram is again fitted by a beta distribution using the method of moments. (C) Corrected individual heterozygosity calculated from data imputed using the estimated parameter values, averaged over 100 imputed data sets. Colors and symbols follow Figure 2. The corresponding uncorrected observed heterozygosity for each individual is indicated in gray.
Figure 5
Figure 5
Simulation procedures. In all procedures, Φ^ represents the allele frequencies estimated from the Native American data, G˜ represents the true genotypes generated under the inbreeding assumption, and W˜ is the observed genotypes with allelic dropout. (A) Procedure to generate the simulated Native American data (experiment 1). (B) Procedure to generate simulated data with population structure (experiment 2). In step 1, the allele frequencies of two subpopulations are generated using the F model. (C) Procedure to generate simulated data with genotyping errors other than allelic dropout (experiment 3).
Figure 6
Figure 6
Fraction of observed missing data vs. fraction of observed homozygotes for one simulated data set. (A) Each symbol represents an individual with fraction x of its nonmissing loci observed as homozygous and fraction y of its total loci observed to have both copies missing. The Pearson correlation between X and Y is r = 0.900 (P < 0.0001, by 10,000 permutations of X while fixing Y). (B) Each point represents a locus at which fraction x of individuals with nonmissing genotypes are observed to be homozygotes and fraction y of all individuals are observed to have both copies missing. r = 0.143 (P = 0.0045).
Figure 7
Figure 7
Estimated dropout rates and corrected heterozygosity for the data simulated on the basis of the Native American data set. (A) Comparison of the estimated sample-specific dropout rates and the assumed true sample-specific dropout rates. (B) Comparison of the estimated locus-specific dropout rates and the assumed true locus-specific dropout rates. (C) Individual heterozygosities in the simulated data. True values of heterozygosity are indicated by green symbols. With allelic dropout applied to true genotypes to generate “observed” data, the uncorrected values of heterozygosity are colored purple. Means of corrected heterozygosities across 100 imputed data sets are colored black. Symbols follow Figure 6.
Figure 8
Figure 8
Estimated dropout rates and inbreeding coefficients for simulated data with population structure. (A) Comparison of the estimated sample-specific dropout rates and the assumed true sample-specific dropout rates. (B) Mean squared errors across all the estimated sample-specific dropout rates for each of the 36 data sets shown in A. (C) Comparison of the estimated locus-specific dropout rates and the assumed true locus-specific dropout rates. (D) Mean squared errors across all the estimated locus-specific dropout rates for each of the 36 data sets shown in C. (E) Comparison of the estimated inbreeding coefficient and the assumed true inbreeding coefficient, in which each point corresponds to one of 96 simulated data sets. The 36 solid symbols correspond to the simulated data sets shown in A–D and F. Dashed lines indicate the effective inbreeding coefficients of structured populations under the F model (Equation B11). (F) Overestimation of the inbreeding coefficient, calculated by subtracting the assumed true inbreeding coefficient from the estimated inbreeding coefficient, or ρ^ρ.
Figure 9
Figure 9
Estimated dropout rates and inbreeding coefficients for simulated data with other genotyping errors. (A) Comparison of the estimated sample-specific dropout rates and the assumed true sample-specific dropout rates. (B) Mean squared errors across all the estimated sample-specific dropout rates for each of the 36 data sets shown in A. (C) Comparison of the estimated locus-specific dropout rates and the assumed true locus-specific dropout rates. (D) Mean squared errors across all the estimated locus-specific dropout rates for each of the 36 data sets shown in C. (E) Comparison of the estimated inbreeding coefficient and the assumed true inbreeding coefficient, in which each point corresponds to one of 96 simulated data sets. The 36 solid symbols correspond to the simulated data sets shown in A–D and F. (F) Overestimation of the inbreeding coefficient, calculated by subtracting the assumed true inbreeding coefficient from the estimated inbreeding coefficient, or ρ^ρ.

Similar articles

Cited by

References

    1. Bonin A., Bellemain E., Eidesen P. B., Pompanon F., Brochmann C., et al. , 2004. How to track and assess genotyping errors in population genetics studies. Mol. Ecol. 13: 3261–3273 - PubMed
    1. Broquet T., Petit E., 2004. Quantifying genotyping errors in noninvasive population genetics. Mol. Ecol. 13: 3601–3608 - PubMed
    1. Broquet T., Ménard N., Petit E., 2007. Noninvasive population genetics: a review of sample source, diet, fragment length and microsatellite motif effects on amplification success and genotyping error rates. Conserv. Genet. 8: 249–260
    1. Buchan J. C., Archie E. A., van Horn R. C., Moss C. J., Alberts S. C., 2005. Locus effects and sources of error in noninvasive genotyping. Mol. Ecol. Notes 5: 680–683
    1. Casella G., Berger R. L., 2001. Statistical Inference, Ed. 2 Duxbury, Pacific Grove, CA

Publication types