. 2012 Oct;192(2):385-96.
doi: 10.1534/genetics.112.142802. Epub 2012 Jul 30.

Comparative oncogenomics implicates the neurofibromin 1 gene (NF1) as a breast cancer driver

Affiliations

Comparative oncogenomics implicates the neurofibromin 1 gene (NF1) as a breast cancer driver

Marsha D Wallace et al. Genetics. 2012 Oct.

Abstract

Identifying genomic alterations driving breast cancer is complicated by tumor diversity and genetic heterogeneity. Relevant mouse models are powerful for untangling this problem because such heterogeneity can be controlled. Inbred Chaos3 mice exhibit high levels of genomic instability leading to mammary tumors that have tumor gene expression profiles closely resembling mature human mammary luminal cell signatures. We genomically characterized mammary adenocarcinomas from these mice to identify cancer-causing genomic events that overlap common alterations in human breast cancer. Chaos3 tumors underwent recurrent copy number alterations (CNAs), particularly deletion of the RAS inhibitor Neurofibromin 1 (Nf1) in nearly all cases. These overlap with human CNAs including NF1, which is deleted or mutated in 27.7% of all breast carcinomas. Chaos3 mammary tumor cells exhibit RAS hyperactivation and increased sensitivity to RAS pathway inhibitors. These results indicate that spontaneous NF1 loss can drive breast cancer. This should be informative for treatment of the significant fraction of patients whose tumors bear NF1 mutations.


Figures
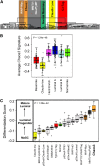
Figure 1
Figure 1
Chaos3 tumors model key human features. (A) Expression microarray dendrogram of Chaos3 mammary tumors and 185 other mouse mammary carcinomas and normal mammary tissue samples. The Chaos3 tumors cluster together as a distinct group near luminal murine models: MYC, PyMT, and Her2/Neu. Genes significantly differentially expressed between Chaos3 tumors and those of other mouse models are presented in File S1. (B) Boxplot of the Chaos3 gene signature in the UNC337 human breast tumor data set. Chaos3 tumors have higher signature expression in human luminal, HER2-enriched, and normal-like intrinsic subtypes. (C) Chaos3 differentiation score (D score) in relationship with other genetically engineered mouse models (GEMMs). The high D score shows that Chaos3 tumors more closely resemble the expression signature of mature human luminal cells relative to all other mouse models analyzed. (B and C) P-values reflect statistical significance of ANOVAs. MaSC, mammary stem cell.
Figure 2
Figure 2
Recurrent CNAs in Chaos3 mammary tumors overlap with those in human breast cancer, including Nf1 deletion. (A) KCSmart analysis of combined aCGH data from 12 Chaos3 tumors, (nine mammary and three nonmammary). The most significant amplification peaks (red) lie on Chrs 12 and 16, and deletions (green) on Chrs 4, 5, and 11. (B) Overlap of mouse (Mmu) Chaos3 recurrent deletions with human (Hs) breast tumor CNAs. Human gene orders are shown. Thick red bars indicate the critical regions of mouse deletions, the subregions that, among all alterations in those regions, are common across all or most Chaos3 tumors. Of Chaos3 tumors with CNAs in these regions, the percentage of those containing the critical region is as follows: Chr 4 132 M = 86%; Chr 4 148 M = 71%; Chr 5 = 86%; Chr 11 = 86% (100% for Nf1, Ksr1, and Wsb1). The thick black bars to the right of the gene symbols indicate corresponding recurrent segmental CNAs in human breast cancers (limited level 4 data set from TCGA). Note that the Chr 11 deletions are single events in mice (asterisks on red part indicate these sequences are juxtaposed and contiguous in the mouse genome), and it is possible that the interval between NOS2 and NF1 may also be deleted as single events in human breast cancers, since the intervening genes are present in the hemizygous state in a high percentage of tumors according to extended TCGA data sets.
Figure 3
Figure 3
Nf1 is deleted in Chaos3 mammary tumors. (A) Recurrent deletions detected by aCGH on Chr 11 at ∼79 Mb, specific to Chaos3 mammary tumors. The broken red line indicates significant log2 ratios. Tumor 17883 is a mediastinal lymphoma/leukemic tumor, 16862 is a histiocytic sarcoma in the uterus, 10658 is a bone tumor, and the other tumors are mammary. Mammary tumors 16168 and 12352 did not have significant detectable deletion by aCGH, but did by qPCR (Table S4). (B, Top) aCGH results of two primary Chaos3 mammary tumors and one Chaos3 mammary tumor cell line. Dots substantially above the log2 ratio line correspond to loci amplified in the tumor, and dots below are underrepresented. Arrows mark loci commonly amplified in Chaos3 tumors regardless of tumor type, and asterisks mark commonly deleted loci segregating specifically with mammary tumors. (Bottom) Expanded view of Chr 11 deletion. Red bars indicate aCGH or qPCR confirmed deletion in all nine Chaos3 mammary tumors overlapping Nf1. (C) qRT–PCR analysis of Nf1 mRNA levels across the transcript in Chaos3 tumors. Percentage of expression is relative to an MMTV-PyVT tumor as control, which does not have loss of Nf1. Error bars show standard error of the mean. Mammary tumor 15259 is heterozygously deleted for Nf1, and the others are homozygously deleted. Residual signal may reflect biopsy contamination or tumor heterogeneity.
Figure 4
Figure 4
Nf1 deletion in Chaos3 mammary tumors leads to increased activated RAS and sensitivity to PI3K and MAPK inhibitors. (A) Western blot analysis of Chaos3 tumors for NF1 and active RAS levels. The mammary tumors without detectable NF1 have homozygous deletions of Nf1 (Table S4), whereas the bone tumor and mammary tumor 22418 contain no Nf1 deletions. The presence of NF1 protein is inversely correlated with the level of activated (GTP-bound RAS). (B) NF1 and the Ras pathway. NF1 loss leads to increased cell proliferation and transcription of antiapoptosis genes because of failure to negatively regulate Ras. Inhibitors used in this study to slow proliferation of NF1-deficient tumor cells are shown in red type. Not all downstream targets are shown. RTK, receptor tyrosine kinase. (C) Cell proliferation assays showing sensitivity of Chaos3 tumors to rapamycin and Mek1 inhibitor PD98059. Line colors: red, HeLa; brown, MCF-7 and MDA-MB231; blue, PyVT; and black, Chaos3. BT, bone tumor; MT, mammary tumor; MTCL, mammary tumor cell line.
Figure 5
Figure 5
Frequent NF1 deletion in human breast cancer. (A) Percentage of NF1 CNA and mutation in 511 human breast tumors, including 57 Her2-Enriched and 93 Basal breast tumors (publically available TCGA data). Note that 27.7% of human breast tumors have NF1 deletion or mutation, and HER2-enriched and basal breast tumor subtypes have ≥40% NF1 deletion or mutation. (B) Boxplot of NF1 mRNA expression vs. copy number in human breast cancer. Data are from TCGA Research Network. P-value is for ANOVA between het-loss and diploid groups, indicating expression levels significantly correlate with genomic deletion status.

Similar articles

Cited by

References

    1. Arima Y., Hayashi H., Kamata K., Goto T. M., Sasaki M., et al. , 2009. Decreased expression of neurofibromin contributes to epithelial-mesenchymal transition in neurofibromatosis type 1. Exp. Dermatol. 19: e136–e141 - PubMed
    1. Bajenaru M. L., Donahoe J., Corral T., Reilly K. M., Brophy S., et al. , 2001. Neurofibromatosis 1 (NF1) heterozygosity results in a cell-autonomous growth advantage for astrocytes. Glia 33: 314–323 - PubMed
    1. Berger A. H., Knudson A. G., Pandolfi P. P., 2011. A continuum model for tumour suppression. Nature 476: 163–169 - PMC - PubMed
    1. Blow J. J., Ge X. Q., Jackson D. A., 2011. How dormant origins promote complete genome replication. Trends Biochem. Sci. 36: 405–414 - PMC - PubMed
    1. Carey L. A., Perou C. M., Livasy C. A., Dressler L. G., Cowan D., et al. , 2006. Race, breast cancer subtypes, and survival in the Carolina Breast Cancer Study. JAMA 295: 2492–2502 - PubMed

Publication types