. 2012 Oct;192(2):671-82.
doi: 10.1534/genetics.112.143396. Epub 2012 Jul 30.

Clonal interference in the evolution of influenza

Affiliations

Clonal interference in the evolution of influenza

Natalja Strelkowa et al. Genetics. 2012 Oct.

Abstract

The seasonal influenza A virus undergoes rapid evolution to escape human immune response. Adaptive changes occur primarily in antigenic epitopes, the antibody-binding domains of the viral hemagglutinin. This process involves recurrent selective sweeps, in which clusters of simultaneous nucleotide fixations in the hemagglutinin coding sequence are observed about every 4 years. Here, we show that influenza A (H3N2) evolves by strong clonal interference. This mode of evolution is a red queen race between viral strains with different beneficial mutations. Clonal interference explains and quantifies the observed sweep pattern: we find an average of at least one strongly beneficial amino acid substitution per year, and a given selective sweep has three to four driving mutations on average. The inference of selection and clonal interference is based on frequency time series of single-nucleotide polymorphisms, which are obtained from a sample of influenza genome sequences over 39 years. Our results imply that mode and speed of influenza evolution are governed not only by positive selection within, but also by background selection outside antigenic epitopes: immune adaptation and conservation of other viral functions interfere with each other. Hence, adapting viral proteins are predicted to be particularly brittle. We conclude that a quantitative understanding of influenza's evolutionary and epidemiological dynamics must be based on all genomic domains and functions coupled by clonal interference.


Figures

Figure 1
Figure 1
Modes of evolution under linkage: Clonal interference vs. episodic selective sweeps. The figure shows strain trees of the influenza evolution model (see text). Nodes of the tree represent strains with distinct HA sequences. Mutations are mapped on individual branches of the tree, all fixed changes appear on the trunk of the tree (thick line). For each node, the horizontal coordinate D counts the number of mutations from the root to its strain sequence, and the vertical coordinate Φ is the sum of their selection coefficients (the so-called cumulative fitness flux (Mustonen and Lässig 2007, 2009, 2010)). Upward (green) and downward (red) arrows indicate individual branches with positive and negative fitness flux, respectively. (A) Clonal interference. In this mode, high supply of beneficial mutations generates competition between coexisting clones: many beneficial changes reach substantial frequencies, but only a fraction of them are fixed (thick green arrows on the trunk), while others are eventually outcompeted (thin green arrows off the trunk). Neutral evolution (represented by planar subtrees) occurs for limited periods within subpopulations. (B) Episodic sweeps. In this mode, low supply of beneficial mutations generates selective sweeps interspersed with extended periods of neutral evolution. Interference interactions are negligible; i.e., all beneficial mutations reaching substantial frequencies are fixed (all green arrows are on the trunk). We show that the evolution of influenza A (H3N2) is governed by clonal interference and not by episodic sweeps; see text and Figure 4.
Figure 2
Figure 2
Genetic linkage in the influenza HA1 domain. For pairs of mutations with haplotype frequency x12 and marginal (allele) frequencies x1 and x2, the scaled haplotype frequency y12 = x12/min(x1, x2) is plotted against the larger allele frequency, xmax = max(x1, x2). Yearly frequency data are shown for 934 pairs of nonsynonymous epitope polymorphisms (1969 green points), which have an average frequency correlation C=0.948. Most points show maximum linkage disequilibrium characteristic of complete genetic linkage; i.e., y = 1 for polymorphisms in nested clones and y = 0 for polymorphisms in disjoint clones (these points are shown with random y values in the interval (1, 1.02) and (−0.02, 0), respectively, to make a larger number of points visible). Some mutations originate in multiple clones and break complete linkage, as shown by values 0 < y12 < 1. However, the overall pattern is far from linkage equilibrium (y12 = xmax, dashed line). Analogous data for other polymorphism classes are shown in Figure S3.
Figure 3
Figure 3
Influenza evolves by recurrent selective sweeps. The histories of 160 fixed polymorphisms in the influenza HA1 domain signal recurrent selective sweeps consistent with clonal interference: (A) Histogram of fixation years between 1969 and 2007 in three polymorphism classes (blue, synonymous; red, nonsynonymous non-epitope; green, nonsynonymous epitope). About 70% of all fixations occur in eight major fixation clusters containing eight or more mutations (columns reaching above shaded area, dashed lines). (B) Sequence diversity vs. year of occurrence, contributions of the three polymorphism classes (blue, red, and green line), and total divergence (black line). Dips in diversity are correlated with major fixation clusters. Diversity is measured by the expected number of pairwise nucleotide differences per unit sequence length between strains of the same year. (C) Histogram of the number of yearly nucleotide fixation events (bars); major fixation clusters are highlighted (light bars). The data distribution deviates strongly from a Poisson distribution with the same mean value of 4.1 substitutions per year (dashed line). (D) Histogram of polymorphism lifetimes between entry and fixation of the new allele. The corresponding normalized distributions are similar in all three mutation classes, with average lifetimes between 2.9 years and 3.1 years.
Figure 4
Figure 4
Inference of selection and clonal interference from polymorphism time series. The frequency propagator statistics g(x) and h(x), as defined by Equations 2 and 3, are evaluated for influenza HA1 and compared to simulated ratios for the minimal sequence evolution model. (A) Influenza frequency propagator ratio g(x) for nonsynonymous non-epitope and epitope mutations (red and green diamonds, error bars are given by sampling fluctuations) with respect to the baseline of synonymous changes (blue line). These data are plotted together with simulations of g(x) for the minimal model in the clonal interference mode (red and green circles); cf. Figure 1A. In the influenza data, the epitope frequency propagator ratio takes values g(x) > 2 for x > 0.6, signaling predominantly positive selection. For non-epitope sites, g(x) < 1 indicates predominantly negative selection. Both features of the influenza data are reproduced by the model results. (B) Influenza loss propagator ratio h(x) for nonsynonymous non-epitope and epitope mutations (red and green diamonds), plotted together with simulations of h(x) for the minimal model in the clonal interference mode (red and green circles). The epitope loss propagator ratio takes values h(x) > 1 for x > 0.3, signaling positive selection acting on mutations harbored in outcompeted clones. This is again reproduced by the model results. (C) Simulations of g(x) in the mode of episodic sweeps (red and green open circles); cf. Figure 1B. The form of g(x) does not match the influenza data (diamonds, same as in A). In the model dynamics, g(x) < 1 for epitope mutations signals a low rate of adaptation. (D) Simulations of h(x) in the mode of episodic sweeps (red and green open circles). The form of h(x) does not match the influenza data (diamonds, same as in B). In the model dynamics, h(x) < 1 for epitope mutations signals the absence of interference interactions. Model parameters: sequence length Lep = 120 (epitope sites), Lne = 160 (non-epitope sites), mutation rate μ = 5.8 × 10⁻³/year, average scaled selection strength σN=100, selection flip rates γ = 3.3 × 10⁻²/year (clonal interference), and γ = 3.6 × 10⁻³/year (episodic sweeps). For model and simulation details, see File S1. Comparisons with further control models are shown in Figure S7.
Figure 5
Figure 5
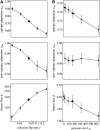
Genome functionality and speed of adaptation. The degree of adaptation, α, characterizes the functionality of a gene segment; the mean fitness flux, ϕ, measures the speed of adaptation (Mustonen and Lässig, 2007, 2009, 2010). (A) Model simulation results for αep (epitope sites), αne (non-epitope sites), and ϕ are plotted against the selection flip rate γ at epitope sites (solid diamonds, influenza calibration point γ = 3.3 × 10⁻²/year; shaded circles, episodic sweeps for γ = 3.6 × 10⁻³/year). All other model parameters are kept fixed to the influenza calibration point; see Figure 3. There is a γ-dependent adaptive genetic load (1 − αep) on epitope sites and (1 − αne) on linked non-epitope sites, and the fitness flux ϕ increases sublinearly with γ. (B) The same quantities are plotted against the non-epitope genome size Lne, with all other model parameters kept fixed (solid diamonds, influenza calibration point Lne = 120). The epitope genetic load (1 − αep) increases and the fitness flux ϕ decreases with increasing length of linked sequence.

References

    1. Atwood K. C., Schneider L. K., Ryan F. J., 1951. Periodic selection in Escherichia coli. Proc. Natl. Acad. Sci. USA 37: 146–155 - PMC - PubMed
    1. Bao Y., Bolotov P., Dernovoy D., Kiryutin B., Zaslavsky L., et al. , 2008. The influenza virus resource at the National Center for Biotechnology Information. J. Virol. 82(2): 596–601 - PMC - PubMed
    1. Bhatt S., Holmes E. C., Pybus O. G., 2011. The genomic rate of molecular adaptation of the human influenza A virus. Mol. Biol. Evol. 28: 2443–2451 - PMC - PubMed
    1. Bloom J. B., Glassman M. J., 2009. Inferring stabilizing nutations from protein phylogenies: application to influenza hemagglutinin. PLOS Comput. Biol. 5: e1000349. - PMC - PubMed
    1. Bolthausen E., Sznitman A. S., 1998. On Ruelle’s probability cascades and an abstract cavity method. Commun. Math. Phys. 197: 247–276

Publication types

MeSH terms

Substances