. 2012 Oct;32(19):3913-24.
doi: 10.1128/MCB.00068-12. Epub 2012 Jul 30.

Expression profiling during mammary epithelial cell three-dimensional morphogenesis identifies PTPRO as a novel regulator of morphogenesis and ErbB2-mediated transformation

Affiliations

Expression profiling during mammary epithelial cell three-dimensional morphogenesis identifies PTPRO as a novel regulator of morphogenesis and ErbB2-mediated transformation

Min Yu et al. Mol Cell Biol. 2012 Oct.

Abstract

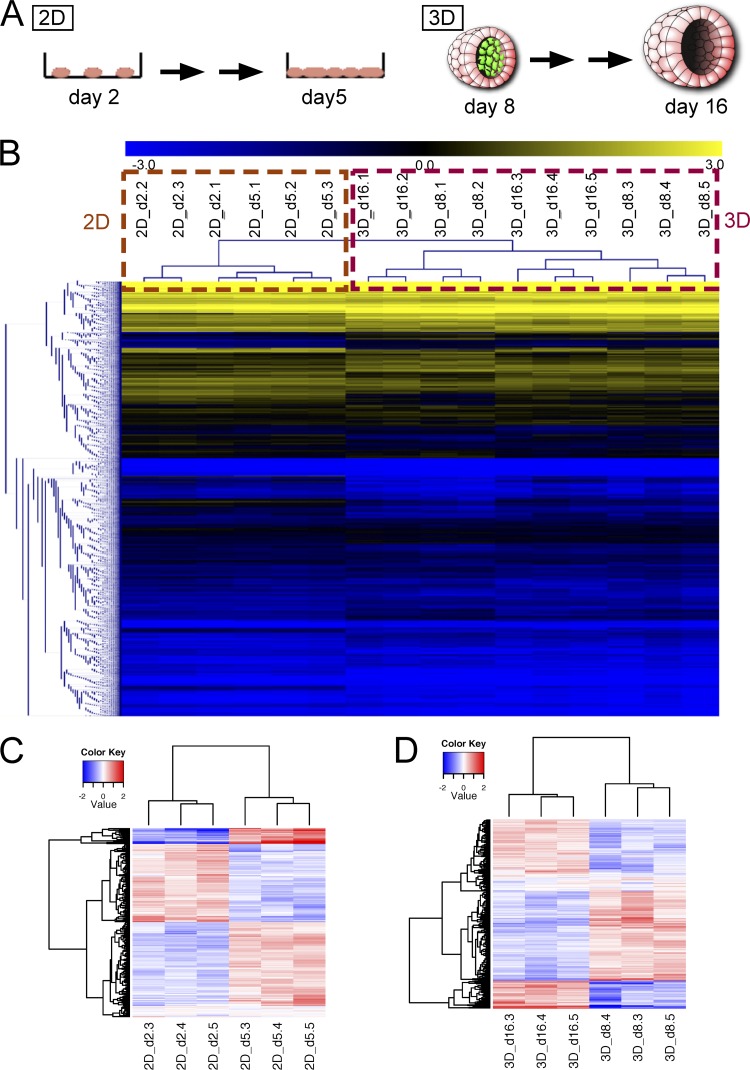
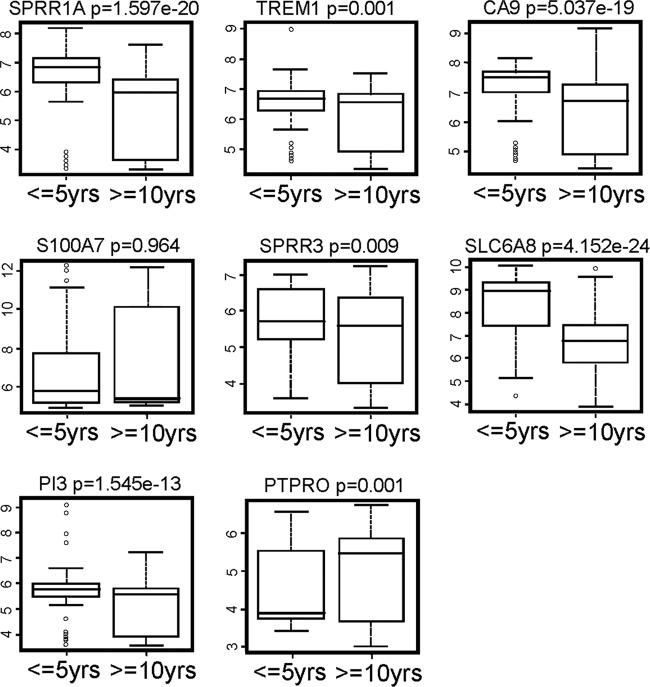
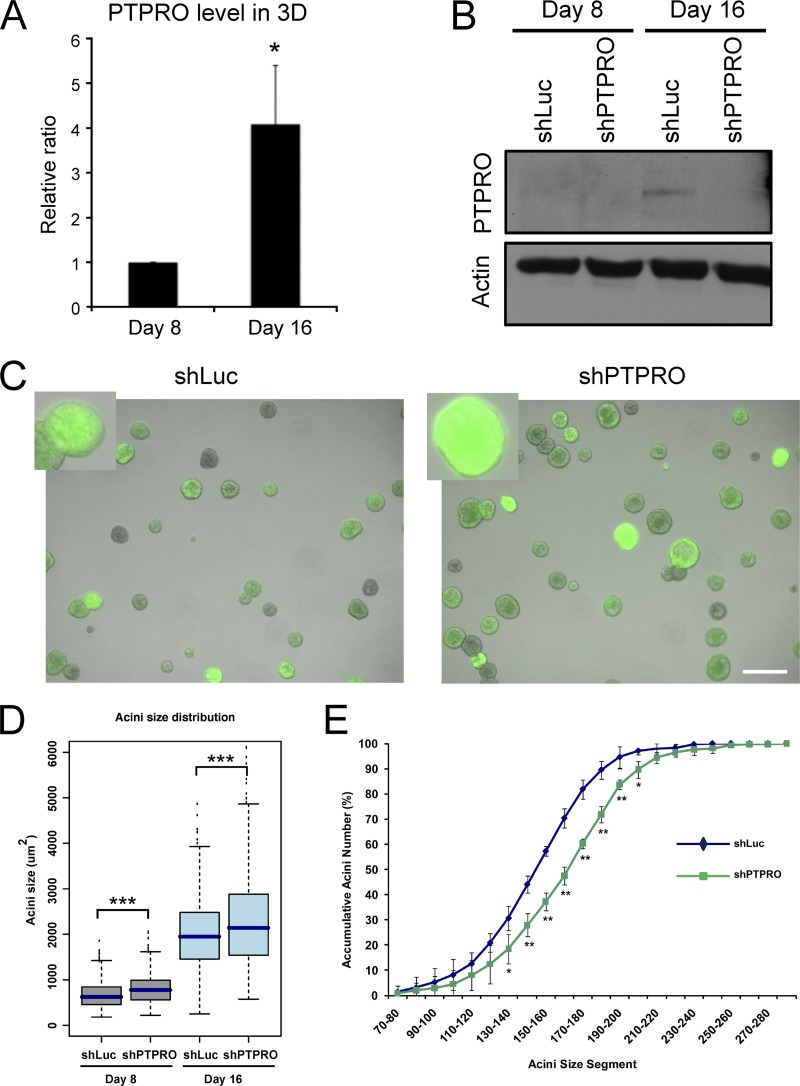
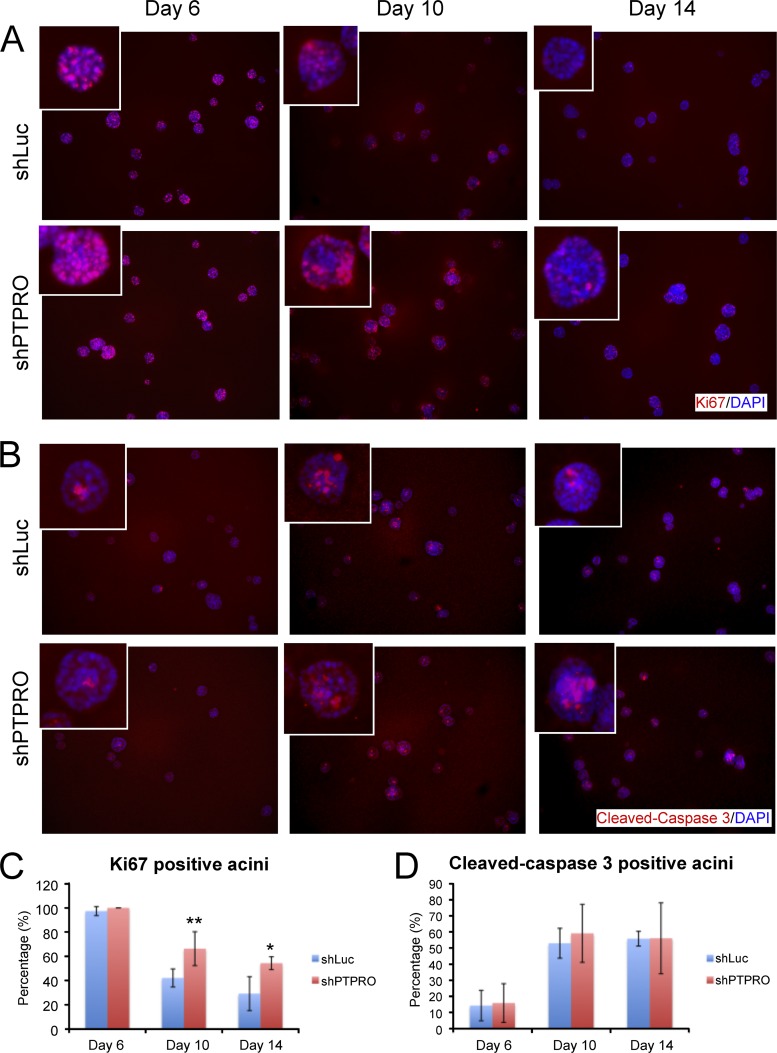
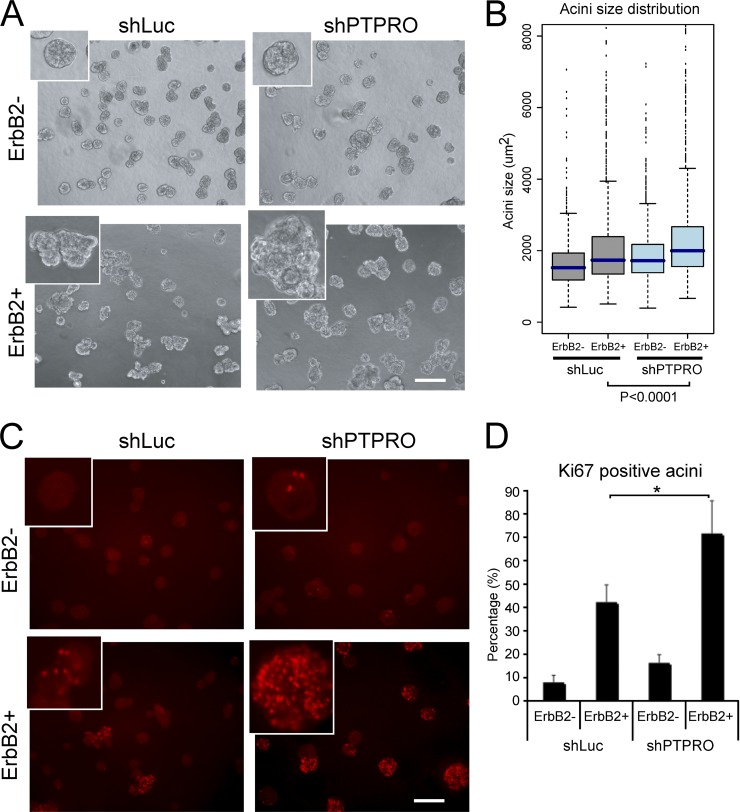
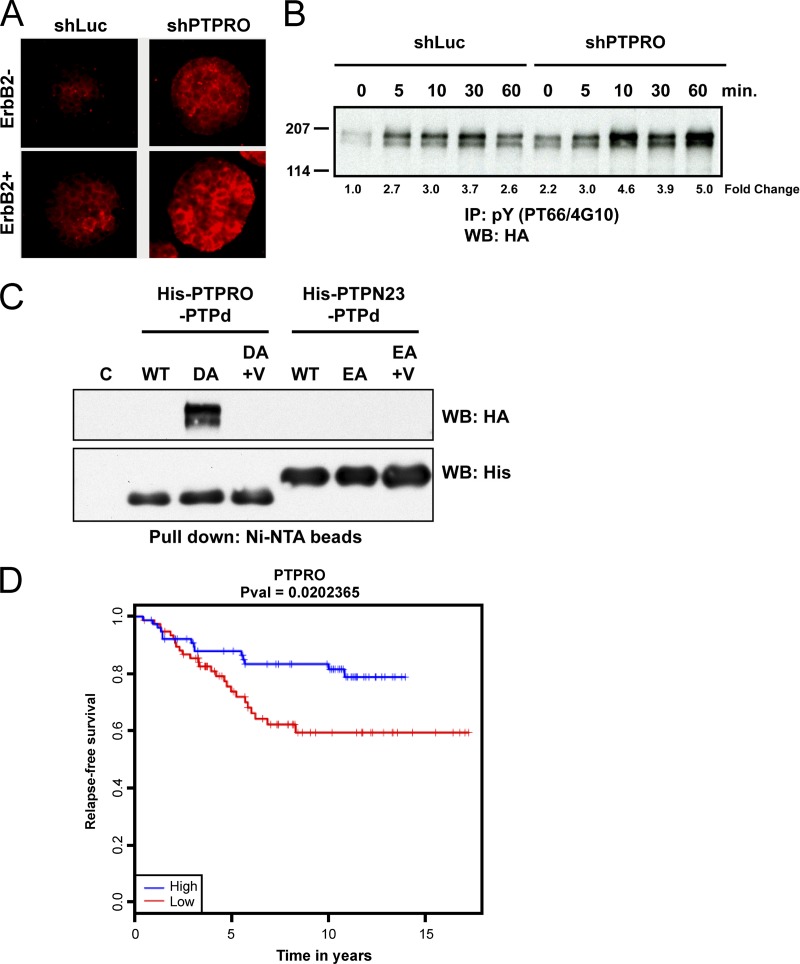
Identification of genes that are upregulated during mammary epithelial cell morphogenesis may reveal novel regulators of tumorigenesis. We have demonstrated that gene expression programs in mammary epithelial cells grown in monolayer cultures differ significantly from those in three-dimensional (3D) cultures. We identify a protein tyrosine phosphate, PTPRO, that was upregulated in mature MCF-10A mammary epithelial 3D structures but had low to undetectable levels in monolayer cultures. Downregulation of PTPRO by RNA interference inhibited proliferation arrest during morphogenesis. Low levels of PTPRO expression correlated with reduced survival for breast cancer patients, suggesting a tumor suppressor function. Furthermore, we showed that the receptor tyrosine kinase ErbB2/HER2 is a direct substrate of PTPRO and that loss of PTPRO increased ErbB2-induced cell proliferation and transformation, together with tyrosine phosphorylation of ErbB2. Moreover, in patients with ErbB2-positive breast tumors, low PTPRO expression correlated with poor clinical prognosis compared to ErbB2-positive patients with high levels of PTPRO. Thus, PTPRO is a novel regulator of ErbB2 signaling, a potential tumor suppressor, and a novel prognostic marker for patients with ErbB2-positive breast cancers. We have identified the protein tyrosine phosphatase PTPRO as a regulator of three-dimensional epithelial morphogenesis of mammary epithelial cells and as a regulator of ErbB2-mediated transformation. In addition, we demonstrated that ErbB2 is a direct substrate of PTPRO and that decreased expression of PTPRO predicts poor prognosis for ErbB2-positive breast cancer patients. Thus, our results identify PTPRO as a novel regulator of mammary epithelial transformation, a potential tumor suppressor, and a predictive biomarker for breast cancer.


Figures

Fig 1
Fig 1
Gene expression analysis of proliferation arrest in 2D and 3D cultures. (A) Illustration of microarray designs for 2D and 3D cultures. MCF-10A cells were plated in 2D and in 3D cultures. Total mRNAs were extracted from cells at day 2 and day 5 in 2D, as well as at day 8 and day 16 in 3D, and were hybridized onto Affymetrix HGU-133A arrays. (B) Two-way hierarchical clustering of gene expressions from all the conditions. Genes are in rows, and experiments are in columns. Data plotted were the ratios of intensity value of each gene at each experiment over the mean value of all data points. Yellow represents positive ratios, and blue represents negative ratios. (C) Hierarchical clustering of differentially expressed genes in 2D at day 2 and day 5. (D) Hierarchical clustering of differentially expressed genes in 3D at day 8 and day 16.
Fig 2
Fig 2
Box plots of gene expression levels in breast cancer patients for the top eight upregulated genes during proliferation arrest identified in 3D cultures. P values are shown above the plots.
Fig 3
Fig 3
Suppression of PTPRO increased acinar size. (A) Quantitative RT-PCR validation of PTPRO expression changes during 3D morphogenesis. Results were normalized to endogenous GAPDH control, and the relative ratios of day 16 to day 8 were plotted (n = 3; *, P < 0.05; data are means ± standard deviations). (B) Analysis of protein level of PTPRO in 3D morphogenesis in shLuc and shPTPRO cells by Western blotting. (C) Phase images of acinar structures of PTPRO-suppressed cells (shPTPRO) and control cells (shLuc) in 3D at day 12 (scale bar = 100 μm). Expression of green fluorescent protein identifies acini derived from cells expressing the PTPRO shRNA. (D) Distribution of acinar sizes at day 8 and day 16 structures plotted in box plots. Each condition represented at least 600 acini from three independent experiments (***, P < 0.001). (E) Distribution of acinar sizes at day 16 plotted in segment accumulative plot. Acinar sizes were grouped into indicated segments. The number of acini that fitted to each size segment was determined and plotted as accumulative number in percentages (n = 3; *, P < 0.05; **, P < 0.01).
Fig 4
Fig 4
PTPRO regulated proliferation arrest but not cell death during morphogenesis. PTPRO-suppressed cells (shPTPRO) and control cells with shRNA for luciferase (shLuc) were grown in 3D cultures, and immunofluorescence assays were performed on day 6, day 10, and day 14 for proliferation marker and apoptosis marker. Scale bar = 100 μm. (A) Cells were probed with anti-Ki67 (red) antibody for active proliferation. Nuclei were stained by DAPI (blue). (B) Cells were probed with apoptotic marker cleaved-caspase 3 antibody (red). (C) Quantification of percentage of Ki67-positive acini (>3 Ki67-positive cells per acinus; *, P < 0.05; **, P < 0.01; data are means ± standard deviations). (D) Quantification of percentage of cleaved-caspase 3-positive acini.
Fig 5
Fig 5
Suppression of PTPRO cooperated with ErbB2 to promote proliferation. (A) Phase images of day 12 acinar structures from 10A.B2.shPTPRO (shPTPRO) and control 10A.B2.shLuc (shLuc) cells with (bottom panels) or without (top panels) ErbB2 activation for 4 days. Scale bar = 100 μm. (B) Box plot for distribution of area of the acinar structures of these cell lines with (ErbB2+) or without (ErbB2−) ErbB2 activation. (C) Ki67 staining for day 18 acinar structures from shLuc or shPTPRO cells grown with (bottom panels) or without (top panels) ErbB2 activation for 2 days (red). Scale bar = 100 μm. (D) Plot of the percentage of Ki67-positive acini measured in these two cell lines for at least 600 acini from three independent experiments. *, P < 0.05.
Fig 6
Fig 6
ErbB2 was a direct substrate of PTPRO. (A) Representative images of immunofluorescent staining of antiphosphotyrosine in 3D acini at day 18 with (bottom panels) or without (top panels) ErbB2 activation for 2 days. (B) Extracts from shLuc and shPTPRO cells with ErbB2 activation for different time points were first immunoprecipitated (IP) with antiphosphotyrosine (pY) antibody and then immunoblotted (WB) for ErbB2 with anti-HA antibody. (C) Purified recombinant His-tagged forms of the catalytic domain of PTPRO or PTPN23 were mixed with pervanadate-treated 10A.B2 cell lysates and then precipitated with Ni-NTA agarose beads. Binding of ErbB2 was assessed by blotting the precipitates with anti-HA antibodies. Anti-His tag antibody blot was used for loading control. C, empty bead control; WT, wild type; DA and EA, PTPRO-D1102A (DA) and PTPN23-E1357A (EA) substrate-trapping mutants in the absence or presence (+V) of vanadate. (D) Kaplan-Meier survival curve in ErbB2-overexpressing patients based on PTPRO expression levels. ErbB2-overexpressing patients were stratified into upper quartile (n = 77) and lower quartile (n = 77) based on the expression level of PTPRO.

Similar articles

Cited by

References

    1. Bentires-Alj M, Neel BG. 2007. Protein-tyrosine phosphatase 1B (PTP1B) is required for HER2/Neu-induced breast cancer. Cancer Res. 67:2420–2424 - PubMed
    1. Bild AH, et al. 2006. Oncogenic pathway signatures in human cancers as a guide to targeted therapies. Nature 439:353–357 - PubMed
    1. Chen B, Bixby JL. 2005. A novel substrate of receptor tyrosine phosphatase PTPRO is required for nerve growth factor-induced process outgrowth. J. Neurosci. 25:880–888 - PMC - PubMed
    1. Chen L, Juszczynski P, Takeyama K, Aguiar RC, Shipp MA. 2006. Protein tyrosine phosphatase receptor-type O truncated (PTPROt) regulates SYK phosphorylation, proximal B-cell-receptor signaling, and cellular proliferation. Blood 108:3428–3433 - PubMed
    1. Christov K, et al. 1991. Proliferation of normal breast epithelial cells as shown by in vivo labeling with bromodeoxyuridine. Am. J. Pathol. 138:1371–1377 - PMC - PubMed

Publication types

MeSH terms

Substances