

Sialoadhesin promotes rapid proinflammatory and type I IFN responses to a sialylated pathogen, Campylobacter jejuni
- PMID: 22851711
- PMCID: PMC3442253
- DOI: 10.4049/jimmunol.1200776
Sialoadhesin promotes rapid proinflammatory and type I IFN responses to a sialylated pathogen, Campylobacter jejuni
Abstract
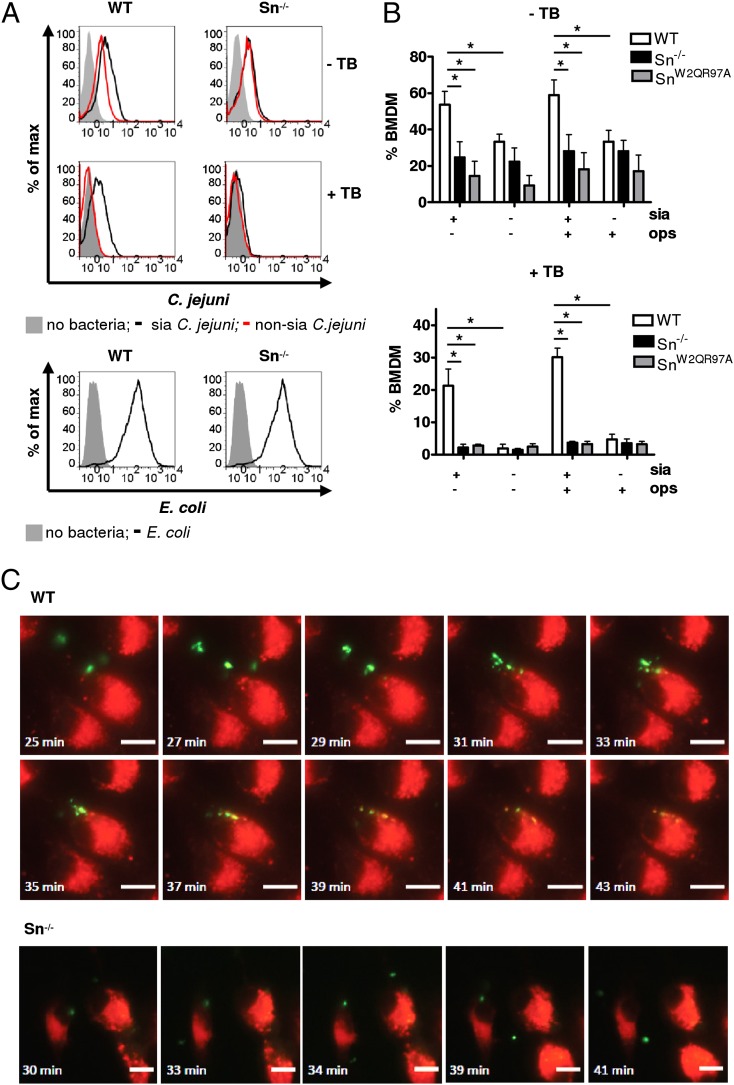
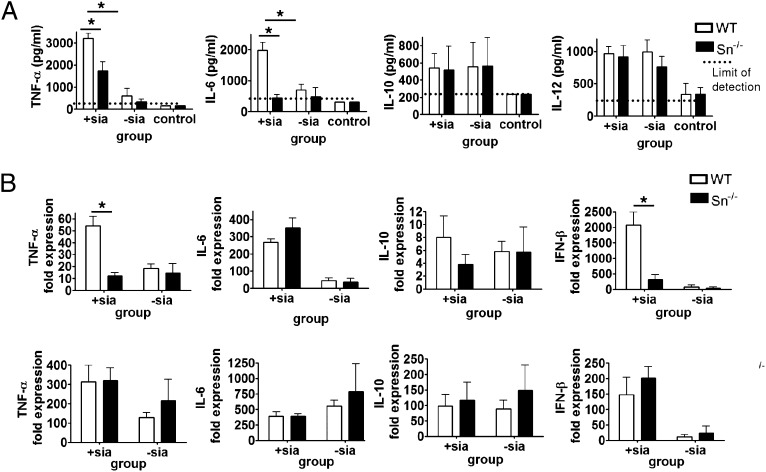
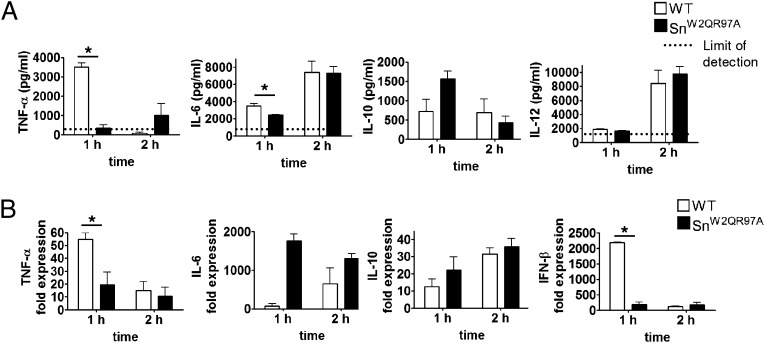
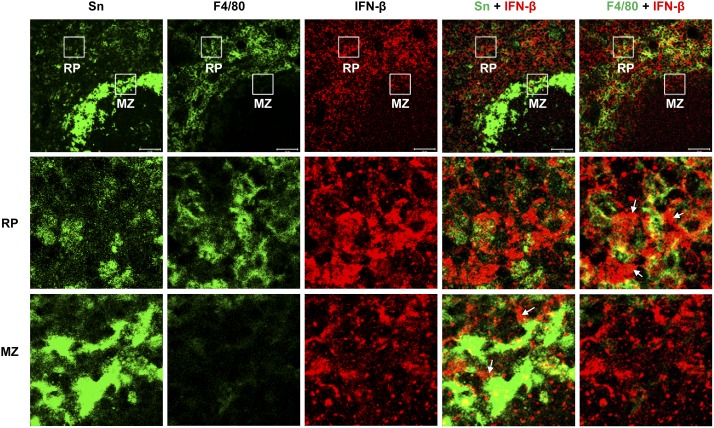
Sialoadhesin (Sn) is a macrophage (Mφ)-restricted receptor that recognizes sialylated ligands on host cells and pathogens. Although Sn is thought to be important in cellular interactions of Mφs with cells of the immune system, the functional consequences of pathogen engagement by Sn are unclear. As a model system, we have investigated the role of Sn in Mφ interactions with heat-killed Campylobacter jejuni expressing a GD1a-like, sialylated glycan. Compared to Sn-expressing bone marrow-derived macrophages (BMDM) from wild-type mice, BMDM from mice either deficient in Sn or expressing a non-glycan-binding form of Sn showed greatly reduced phagocytosis of sialylated C. jejuni. This was accompanied by a strong reduction in MyD88-dependent secretion of TNF-α, IL-6, IL-12, and IL-10. In vivo studies demonstrated that functional Sn was required for rapid TNF-α and IFN-β responses to i.v.-injected sialylated C. jejuni. Bacteria were captured within minutes after i.v. injection and were associated with Mφs in both liver and spleen. In the spleen, IFN-β-reactive cells were localized to Sn⁺ Mφs and other cells in the red pulp and marginal zone. Together, these studies demonstrate that Sn plays a key role in capturing sialylated pathogens and promoting rapid proinflammatory cytokine and type I IFN responses.
Figures


Similar articles
-
Characterization of the specific interaction between sialoadhesin and sialylated Campylobacter jejuni lipooligosaccharides.Infect Immun. 2010 Jul;78(7):3237-46. doi: 10.1128/IAI.01273-09. Epub 2010 Apr 26. Infect Immun. 2010. PMID: 20421384 Free PMC article.
-
Enhanced, sialoadhesin-dependent uptake of Guillain-Barre syndrome-associated Campylobacter jejuni strains by human macrophages.Infect Immun. 2013 Jun;81(6):2095-103. doi: 10.1128/IAI.01437-12. Epub 2013 Mar 25. Infect Immun. 2013. PMID: 23529622 Free PMC article.
-
Role of macrophage sialoadhesin in host defense against the sialylated pathogen group B Streptococcus.J Mol Med (Berl). 2014 Sep;92(9):951-9. doi: 10.1007/s00109-014-1157-y. Epub 2014 May 3. J Mol Med (Berl). 2014. PMID: 24788876 Free PMC article.
-
The immunobiology of Campylobacter jejuni: Innate immunity and autoimmune diseases.Immunobiology. 2016 Apr;221(4):535-43. doi: 10.1016/j.imbio.2015.12.005. Epub 2015 Dec 8. Immunobiology. 2016. PMID: 26709064 Review.
-
Glycoconjugates play a key role in Campylobacter jejuni Infection: interactions between host and pathogen.Front Cell Infect Microbiol. 2012 Feb 14;2:9. doi: 10.3389/fcimb.2012.00009. eCollection 2012. Front Cell Infect Microbiol. 2012. PMID: 22919601 Free PMC article. Review.
Cited by
-
Sialoadhesin (CD169/Siglec-1) is an extended molecule that escapes inhibitory cis-interactions and synergizes with other macrophage receptors to promote phagocytosis.Glycoconj J. 2023 Apr;40(2):213-223. doi: 10.1007/s10719-022-10097-1. Epub 2023 Feb 4. Glycoconj J. 2023. PMID: 36738392 Free PMC article.
-
Human Immunity Against Campylobacter Infection.Immune Netw. 2019 Dec 2;19(6):e38. doi: 10.4110/in.2019.19.e38. eCollection 2019 Dec. Immune Netw. 2019. PMID: 31921468 Free PMC article. Review.
-
Live-cell video microscopy of fungal pathogen phagocytosis.J Vis Exp. 2013 Jan 9;(71):50196. doi: 10.3791/50196. J Vis Exp. 2013. PMID: 23329139 Free PMC article.
-
Pseudaminic acid on Campylobacter jejuni flagella modulates dendritic cell IL-10 expression via Siglec-10 receptor: a novel flagellin-host interaction.J Infect Dis. 2014 Nov 1;210(9):1487-98. doi: 10.1093/infdis/jiu287. Epub 2014 May 13. J Infect Dis. 2014. PMID: 24823621 Free PMC article.
-
The contribution of the programmed cell death machinery in innate immune cells to lupus nephritis.Clin Immunol. 2017 Dec;185:74-85. doi: 10.1016/j.clim.2016.10.007. Epub 2016 Oct 22. Clin Immunol. 2017. PMID: 27780774 Free PMC article. Review.
References
-
- Crocker P. R., Paulson J. C., Varki A. 2007. Siglecs and their roles in the immune system. Nat. Rev. Immunol. 7: 255–266 - PubMed
-
- Hart M. L., Saifuddin M., Spear G. T. 2003. Glycosylation inhibitors and neuraminidase enhance human immunodeficiency virus type 1 binding and neutralization by mannose-binding lectin. J. Gen. Virol. 84: 353–360 - PubMed
-
- Hartnell A., Steel J., Turley H., Jones M., Jackson D. G., Crocker P. R. 2001. Characterization of human sialoadhesin, a sialic acid binding receptor expressed by resident and inflammatory macrophage populations. Blood 97: 288–296 - PubMed
Publication types
MeSH terms
Substances
Grants and funding
LinkOut - more resources
Full Text Sources
Other Literature Sources
Molecular Biology Databases
Research Materials
Miscellaneous
