. 2012 Oct;80(10):3521-32.
doi: 10.1128/IAI.00224-12. Epub 2012 Jul 30.

Modulation of toxin production by the flagellar regulon in Clostridium difficile

Affiliations

Modulation of toxin production by the flagellar regulon in Clostridium difficile

Annie Aubry et al. Infect Immun. 2012 Oct.

Abstract

We show in this study that toxin production in Clostridium difficile is altered in cells which can no longer form flagellar filaments. The impact of inactivation of fliC, CD0240, fliF, fliG, fliM, and flhB-fliR flagellar genes upon toxin levels in culture supernatants was assessed using cell-based cytotoxicity assay, proteomics, immunoassay, and immunoblotting approaches. Each of these showed that toxin levels in supernatants were significantly increased in a fliC mutant compared to that in the C. difficile 630 parent strain. In contrast, the toxin levels in supernatants secreted from other flagellar mutants were significantly reduced compared with that in the parental C. difficile 630 strain. Transcriptional analysis of the pathogenicity locus genes (tcdR, tcdB, tcdE, and tcdA) revealed a significant increase of all four genes in the fliC mutant strain, while transcription of all four genes was significantly reduced in fliM, fliF, fliG, and flhB-fliR mutants. These results demonstrate that toxin transcription in C. difficile is modulated by the flagellar regulon. More significantly, mutant strains showed a corresponding change in virulence compared to the 630 parent strain when tested in a hamster model of C. difficile infection. This is the first demonstration of differential flagellum-related transcriptional regulation of toxin production in C. difficile and provides evidence for elaborate regulatory networks for virulence genes in C. difficile.


Figures

Fig 1
Fig 1
Schematic of flagellar locus from C. difficile 630 (drawn to scale). Black arrows, open reading frames with gene annotations above or below the respective genes. The three regions of the flagellar regulon are indicated by a solid bracket above the gene locus (F1, late-stage flagellar genes; F2, flagellar glycosylation genes; F3, early-stage flagellar genes). Broken arrows below the flagellar locus, location of putative fliA promoter sites; white triangles, genes selected for mutagenesis using the ClosTron system; gray shading, noncoding regions of DNA. Targetron insertion sites and the orientation of the Targetron within each gene are as follows: fliC, base pair (bp) 260, antisense; CD0240, bp 864, sense; fliF, bp 240, antisense; fliG, bp 669, sense; flhB-fliR, bp 266, antisense; fliM, bp 342, sense; fliA, bp 228, sense. Numbers indicating the base pair position (start/end) within the genome are indicated for the F1, F2, and F3 regions.
Fig 2
Fig 2
Motility assays of flagellar mutant strains. The motility of each strain was determined by assessing growth patterns in agar stabs. A motile phenotype produced diffuse growth spreading away from the inoculum stab. Lane 1, 630Δerm; lane 2 630Δerm fliC::erm; lane 3, 630Δerm CD0240:erm; lane 4, 630Δerm fliF::erm; lane 5, 630Δerm fliG::erm; lane 6, 630Δerm flhB-fliR::erm; lane 7, 630Δerm fliM::erm; lane 8, 630Δerm fliA::erm; lane 9, 630Δerm CD3350::erm; lane 10, 630Δerm fliC::erm pMTL84151; lane 11, 630Δerm fliC::erm/pMTL-pfliC.
Fig 3
Fig 3
Toxin activity in broth supernatants measured by cell monolayer rounding assays. Each flagellar mutant strain was grown in TY broth for 4, 7, or 24 h, and toxin activity was compared to that of strain 630Δerm. Appropriate dilutions of sterile culture supernatants (30 μl) were added to 200 μl of HLF cell monolayers, and the extent of cell rounding was monitored at 24 h postincubation using the cytopathic effect scoring system. (A) Four-hour C. difficile supernatants diluted 1/10; (B) 7-h C. difficile supernatants diluted 1/10; (C) 24-h C. difficile supernatants diluted 1/100. (Inset in panel C) Cell rounding generated from the addition of 630Δerm and 630Δerm fliC::erm 24-h supernatants diluted 1/1,000. Columns and error bars represent the mean percent cell rounding ± SEM generated by supernatants from each strain (n = 6). The data were analyzed for significance by one-way ANOVA, followed by Bonferroni's multiple comparison test (**, P < 0.01; ***, P < 0.001; ns, not significant). CD0240, 630Δerm CD0240::erm; fliC, 630Δerm fliC::erm; fliF, 630Δerm fliF::erm; fliG, 630Δerm fliG::erm; fliM, 630Δerm fliM::erm; flhB/fliR, 630Δerm flhB-fliR::erm; CD3350, 630Δerm CD3350::erm.
Fig 4
Fig 4
Measurement of PaLoc gene transcript levels in flagellar mutant strains. Expression levels of tcd genes were determined by quantifying by qRT-PCR the respective mRNA from samples of bacterial culture grown for 4 or 7 h in TY medium. The housekeeping gene rpsJ was used for normalization of cDNA for each gene, and the relative change in toxin-related gene expression for each flagellar mutant was then determined by comparison to the expression for 630Δerm. (A, B) Growth in TY broth for 4 h (A) and 7 h (B). Data represent the mean fold change in expression of mRNA ± SEM (n = 3) compared to the expression for 630Δerm. Bars correspond to tcdR (gray shade), tcdB (gray), tcdE (horizontal lines), tcdA (white/gray outline), tcdC (black), fliA (white/black outline). The flagellar mutant strain is indicated on the x axis, and the fold change (log2) in transcript level relative to that for 630Δerm is indicated on the y axis. Transcript levels that were significantly different from that for the 630Δerm control are indicated with asterisks (one-way ANOVA with Dunnett's multiple comparison test; *, P < 0.05, **, P < 0.01, ***, P < 0.001). 240, 630Δerm CD0240::erm; FliC, 630Δerm fliC::erm; FliF, 630Δerm fliF::erm; FliG, 630Δerm fliG::erm; FliM, 630Δerm fliM::erm; FlhB, 630Δerm flhB-fliR::erm; 3350, 630Δerm CD3350::erm.
Fig 5
Fig 5
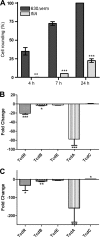
Effect of inactivation of flagellar transcription factor fliA on toxin production. (A) Toxin levels in cell culture supernatants were determined using a cell monolayer rounding assay. Strains 630Δerm and 630Δerm fliA::erm were grown in TY broth for 4, 7, and 24 h. Sterile culture supernatants were diluted 1/10 and added to 200 μl of HLF cell monolayers, and the extent of cell rounding was monitored at 24 h using the cytopathic effect scoring system. Two independent 630Δerm fliA::erm colonies were examined, and results for one representative colony are shown. Columns and error bars represent the mean ± SEM percent cell rounding generated by supernatants from 630Δerm or 630Δerm fliA::erm (n = 4). The data were analyzed for significance by two-tailed, unpaired t test (**, P < 0.01; ***, P < 0.001) comparing 630Δerm and 630Δerm fliA::erm at each supernatant time point. (B, C) qRT-PCR demonstrating the change in PaLoc gene transcript levels in 630Δerm fliA::erm grown in TY broth for 4 h (B) and 7 h (C) compared to those in 630Δerm. Transcript levels that were significantly different from those for 630Δerm are indicated with asterisks (paired one-tailed t test; *, P < 0.05; **, P < 0.01; ***, P < 0.001).
Fig 6
Fig 6
Western blot comparing toxin levels in C. difficile 630Δerm and flagellar mutants. Broth culture supernatants were analyzed for the presence of TcdA (A) and TcdB (B) following TCA precipitation. Lane 1, purified TcdA; lane 2, purified TcdB; lane 3, 630Δerm supernatant; lane 4, 630Δerm fliC::erm supernatant; lane 5, 630Δerm CD0240::erm supernatant; lane 6, 630Δerm fliM::erm supernatant.
Fig 7
Fig 7
Virulence of C. difficile 630Δerm flagellar mutants in hamsters. Kaplan-Meier survival curves demonstrating time to irreversible moribundity after oral infection with approximately 100 spores of C. difficile 630, 630Δerm fliF::erm, 630Δerm fliM::erm, 630Δerm fliC::erm, and 630Δerm flhB-fliR::erm. Data are representative of at least two independent experiments, with n = 5 to 6 hamsters per group.

References

    1. Akerlund T, Svenungsson BB, Lagergren A, Burman LG. 2006. Correlation of disease severity with fecal toxin levels in patients with Clostridium difficile-associated diarrhea and distribution of PCR ribotypes and toxin yields in vitro of corresponding isolates. J. Clin. Microbiol. 44:353–358 - PMC - PubMed
    1. Ananthakrishnan AN. 2011. Clostridium difficile infection: epidemiology, risk factors and management. Nat. Rev. Gastroenterol. Hepatol. 8:17–26 - PubMed
    1. Antunes A, Martin-Verstraete I, Dupuy B. 2011. CcpA-mediated repression of Clostridium difficile toxin gene expression. Mol. Microbiol. 79:882–899 - PubMed
    1. Babcock GJ, et al. 2006. Human monoclonal antibodies directed against toxins A and B prevent Clostridium difficile-induced mortality in hamsters. Infect. Immun. 74:6339–6347 - PMC - PubMed
    1. Calabi E, Calabi F, Phillips AD, Fairweather NF. 2002. Binding of Clostridium difficile surface layer proteins to gastrointestinal tissues. Infect. Immun. 70:5770–5778 - PMC - PubMed

LinkOut - more resources