Clinical Trial
. 2012 Aug 1;35(8):1071-83.
doi: 10.5665/sleep.1992.

Differential effects of sodium oxybate and baclofen on EEG, sleep, neurobehavioral performance, and memory

Affiliations
Clinical Trial

Differential effects of sodium oxybate and baclofen on EEG, sleep, neurobehavioral performance, and memory

Julie Vienne et al. Sleep. .

Abstract

Study objectives: Sodium oxybate (SO) is a GABAβ agonist used to treat the sleep disorder narcolepsy. SO was shown to increase slow wave sleep (SWS) and EEG delta power (0.75-4.5 Hz), both indexes of NREM sleep (NREMS) intensity and depth, suggesting that SO enhances recuperative function of NREM. We investigated whether SO induces physiological deep sleep.

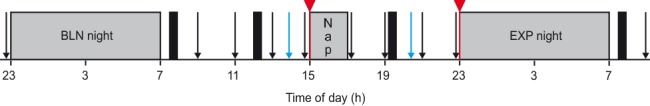
Design: SO was administered before an afternoon nap or before the subsequent experimental night in 13 healthy volunteers. The effects of SO were compared to baclofen (BAC), another GABAβ receptor agonist, to assess the role of GABAβ receptors in the SO response.

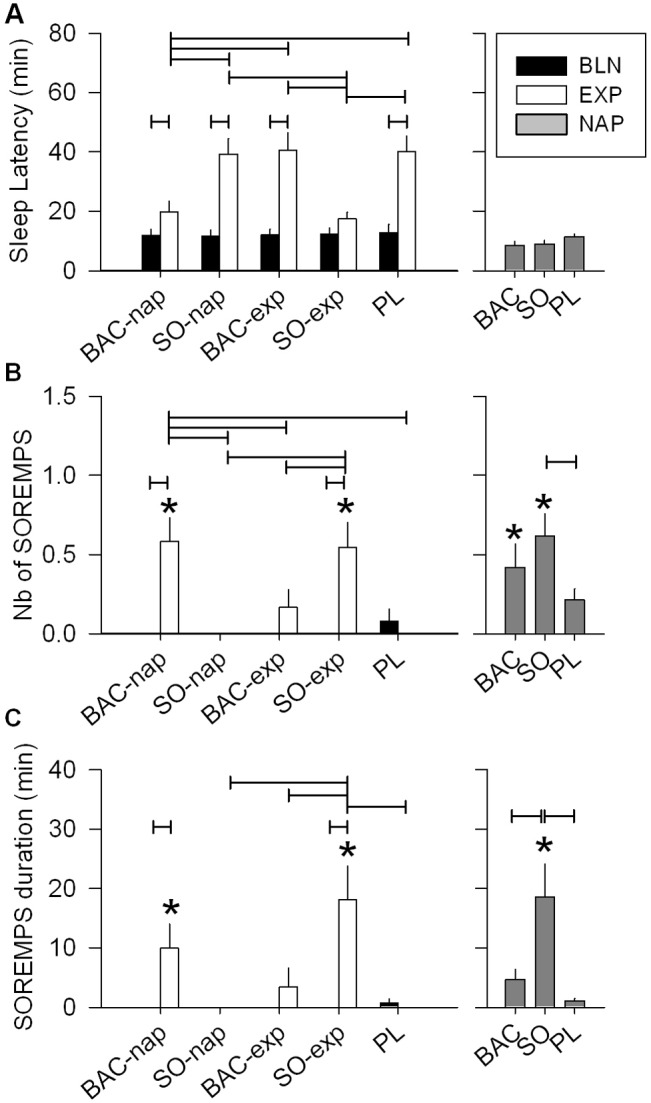
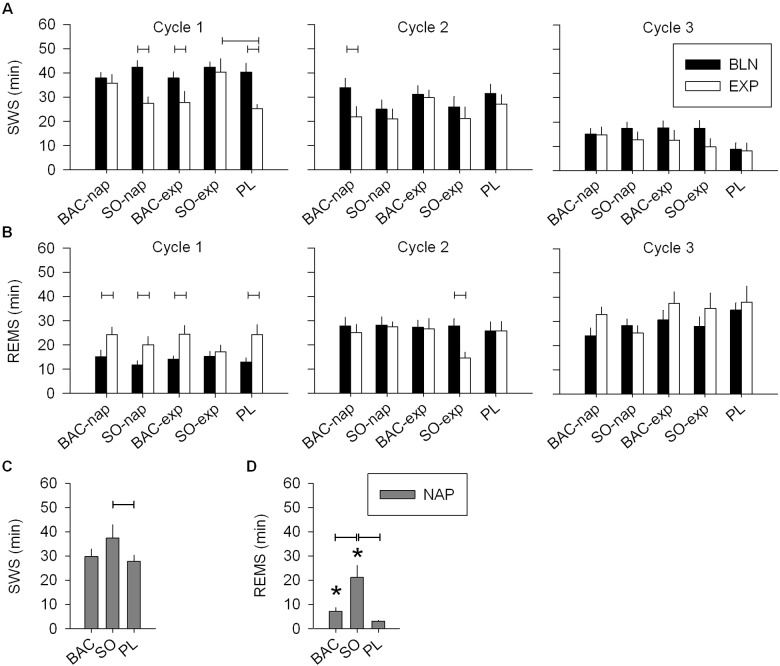
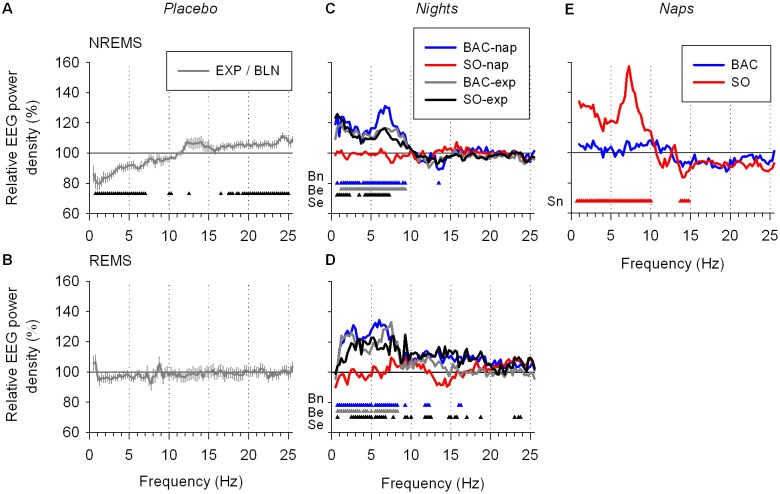
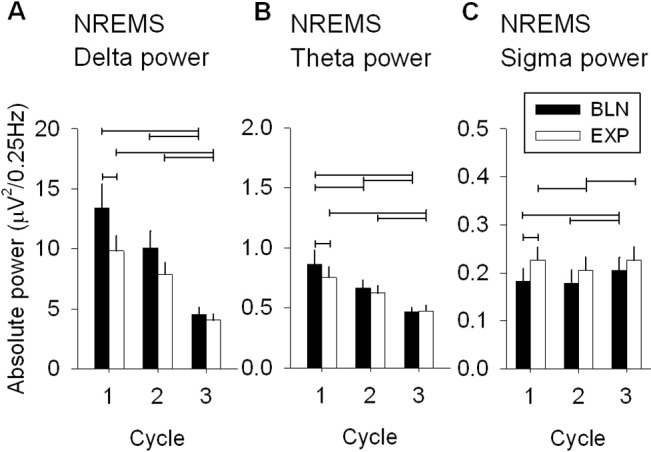
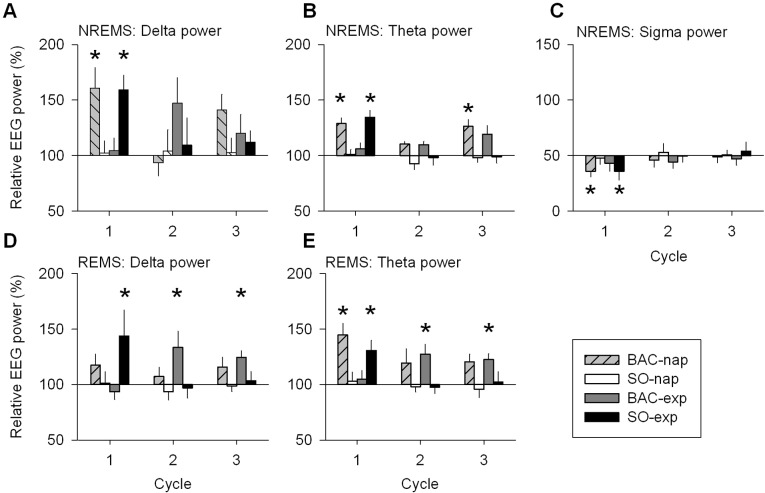
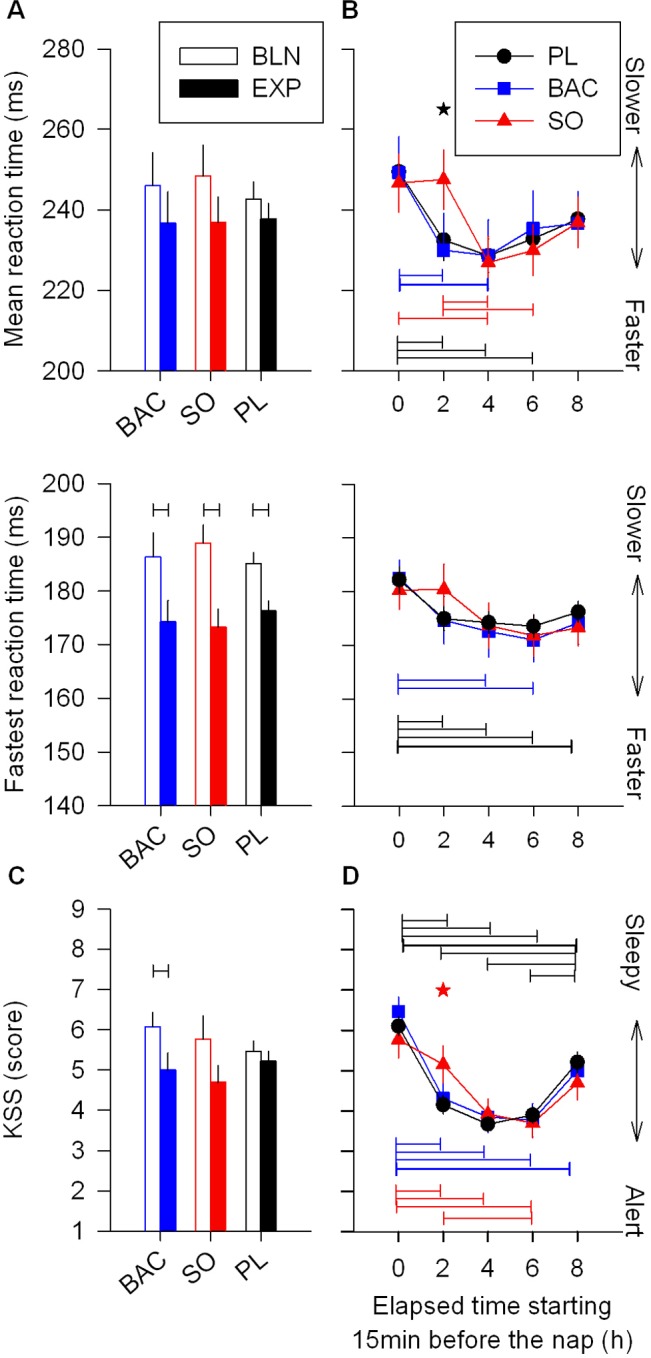
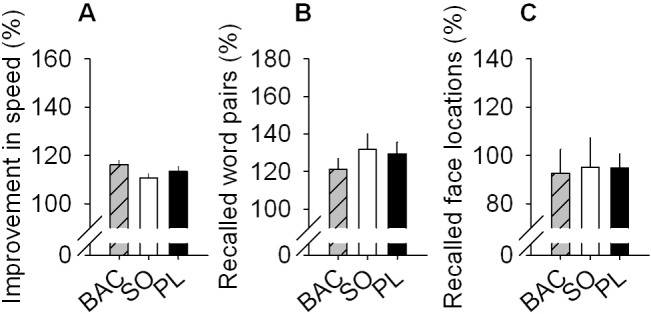
Measurements and results: As expected, a nap significantly decreased sleep need and intensity the subsequent night. Both drugs reversed this nap effect on the subsequent night by decreasing sleep latency and increasing total sleep time, SWS during the first NREMS episode, and EEG delta and theta (0.75-7.25 Hz) power during NREMS. The SO-induced increase in EEG delta and theta power was, however, not specific to NREMS and was also observed during REM sleep (REMS) and wakefulness. Moreover, the high levels of delta power during a nap following SO administration did not affect delta power the following night. SO and BAC taken before the nap did not improve subsequent psychomotor performance and subjective alertness, or memory consolidation. Finally, SO and BAC strongly promoted the appearance of sleep onset REM periods.

Conclusions: The SO-induced EEG slow waves seem not to be functionally similar to physiological slow waves. Our findings also suggest a role for GABAβ receptors in REMS generation.

Keywords: EEG delta activity; Narcolepsy; hypnotic; memory; sleep homeostasis.


Figures

Figure 1
Figure 1
Schedule of a typical study session. Each subject performed 5 sessions, which differed only by the drug treatment condition that they received. Sessions were separated by one week. Subjects started a session with an 8-h habituation night (not shown), spent the day outside the lab, and came back for an 8-h baseline (BLN) night. Before the BLN night, subjects performed vigilance tasks (PVT and KSS, black arrows). The following day, they stayed in the lab executing vigilance tasks every 2 h and 3 memory tasks (blue arrows) before and after a 2-h nap opportunity starting at 15:00. Finally, they spent a last 8-h experimental (EXP) night and left the lab in the morning after having performed the last vigilance tasks. Gray bars indicate times of scheduled sleep periods, and black bars depict mealtimes. In each session, subjects received either 2 placebos (PL) or a placebo and a drug (sodium oxybate [SO] or baclofen [BAC]). Drugs could be administered either before the nap (SO-nap or BAC-nap) or before the EXP night (SO-exp or BAC-exp) (red triangles and lines).
Figure 2
Figure 2
Condition and treatment effects on sleep parameters. (A) The afternoon nap increased sleep latency during the following night (EXP night) compared to the baseline (BLN) night in all treatment conditions (left panel: 2-way mixed-model ANOVA for factors “night” P < 0.0001, “treatment” P < 0.0001, and their interaction P < 0.0001; connected lines: Tukey-Kramer test by treatment, P < 0.05). However, this increase was strongly reduced when BAC was administrated before the nap or SO before the EXP night (connected lines: Tukey-Kramer test by night, P < 0.05). This treatment difference was not seen during the nap (right panel: 1-way mixed-model ANOVA for factor “treatment,” P = 0.1). During nights, number (B) and duration (C) of sleep onset REM periods (SOREMPs) were affected both by drug treatment condition and night (left panel: 2-way mixed-model ANOVA for factors “night” P < 0.0001, “treatment” P < 0.0006, and their interaction P < 0.0003). Only BAC administrated before the nap (BAC-nap) and SO given before the EXP night (SO-exp) showed significant occurrence and increased duration of SOREMPs during the EXP night (paired t-tests P < 0.05, star). Moreover, they showed, respectively, a significant increase in number and a longer duration of SOREMPs compared to the PL condition as well as the BAC-exp and SO-nap conditions (Tukey-Kramer test, P < 0.05). During the nap, number and duration of SOREMPs were affected by the treatment conditions (right panel: 1-way mixed-model ANOVA: factor “treatment,” Tukey-Kramer test, P < 0.05). SO significantly augmented SOREMP number and duration compared to PL, and PL and BAC, respectively. For all panels, bars depict the mean (+1SEM, n = 12-13) values of each variable, connected lines result from Tukey-Kramer test, P < 0.05 and the BLN night of each treatment condition did not differ significantly for any of the variables.
Figure 3
Figure 3
SWS and REMS during the three first sleep cycles of the nighttime sleep and during the nap. (A) During the 1st cycle of the EXP night, SWS was decreased in the PL, SO-nap and BAC-exp conditions, but did not differ from the BLN night in the BAC-nap and SO-exp conditions (left panel: 2-way mixed-model ANOVA for factors “night” P = 0.0001, “treatment” P < 0.03, and their interaction P = 0.05; connected lines: Tukey-Kramer test by treatment for factor “night” P < 0.05). Moreover, SWS was significantly higher when SO was given before the EXP night compared to the PL condition. Overall, during the 2nd and the 3rd cycle, SWS was significantly lower in the EXP night compared to the BLN night (2-way mixed-model ANOVA for factors “night” P < 0.05, “treatment” P > 0.1 and their interaction P > 0.6; paired t-test: factor “night” P < 0.05). (B) REMS was significantly higher in the EXP night compared to the BLN night for the 1st cycle only (left panel (1st cycle): 2-way mixed-model ANOVA for factors “night” P < 0.0001, “treatment” P > 0.4, and their interaction P > 0.4). Interestingly, the SO-exp condition was the unique condition which did not show a significant increase in REMS during the EXP night compared to the BLN night (Tukey-Kramer test by treatment for factor “night” P < 0.05). Moreover, in the 2nd cycle, this same treatment condition exhibited a shorter duration of REMS than the BLN night (1-way mixed-model ANOVA for the PL-SO condition: factor “night” P = 0.002). (C) During the nap, SO increased SWS compared to PL but not compared to BAC (1-way mixed-model ANOVA for factor “treatment” P < 0.03; Tukey-Kramer test P < 0.05). (D) Naps were stopped when REMS was visually identified except when it was a SOREMP (see Materials and Methods and Figure 2). Only SO and BAC treatments showed a significant increase of REMS duration (paired t-tests P < 0.05:*) due to SOREMPs. SO induced a longer duration of REMS than BAC and PL (1-way mixed-model ANOVA for factor “treatment” P < 0.0001, Tukey-Kramer test P < 0.05). For all panels, bars depict the mean values of each variable (mean ± SEM; n = 12-13).
Figure 4
Figure 4
EEG power spectra of NREMS and REMS during nighttime sleep and during the nap. (A) To quantify the effect of a nap on the subsequent sleep (the EXP night), the ratio of absolute NREMS spectra in the EXP and BLN nights for the PL condition (EXP/BLN) was calculated yielding to a relative NREMS spectrum where 100% represents the BLN night. Relative NREMS spectrum differed significantly among nights and frequencies (2-way mixed-model ANOVA for factors “night” P < 0.05, “frequency bin,” P < 0.0001, and their interaction P = 1.0. Low frequency bins (0.75-7.25 Hz) were significantly lower and a bin from the sigma band (12.5 Hz) as well as overall high frequency bins (17.5-25 Hz) were significantly higher during the EXP night compared to the BLN night (black triangles: one-way mixed-model ANOVA by “frequency bin” for factor “night” P < 0.05) (B) The REMS ratio EXP/BLN in the PL condition. Relative REMS spectrum did not differ significantly between nights (2-way mixed-model ANOVA for factors “night” P > 0.1, “frequency bin” P < 0.0001, and their interaction P = 1.0). (C, D) To illustrate the comparison of each treatment condition to the PL condition, relative NREMS and REMS spectra of each drug treatment condition (EXP/BLN) were expressed as a percentage of relative NREMS spectrum of the PL condition depicted in A andB,respectively. Relative NREMS and REMS spectra during the EXP night were affected by treatment condition and by frequency bin (2-way mixed-model ANOVA: factors “treatment” P < 0.0001, “frequency bin” P < 0.0001, and their interaction P < 0.0001). Overall, the BAC-nap, BAC-exp and SO-exp conditions differed significantly from the PL condition, while the SO-nap condition did not (Dunnett-Hsu test [control = PL] P < 0.05). Colored triangles depict frequency bins for which power differed significantly from the PL condition (Dunnett-Hsu test P < 0.05, blue: BAC-nap [Bn], gray: BAC-exp [Be] and red: SO-exp [Se]). (E) During the nap relative NREMS spectra after the SO and BAC treatments were expressed as a percentage of the PL treatment. Overall, relative NREMS spectrum of the SO treatment was different from that of the PL treatment, while that of the BAC treatment did not differ from the 2 others (2-way mixed-model ANOVA for factors “treatment” P < 0.0001, “frequency bin” P < 0.0001, and their interaction P = 0.016; Dunnett-Hsu test P < 0.05). Triangles illustrate frequency bins for which power differed significantly from the PL treatment (Dunnett-Hsu test P < 0.05, red: SO [Sn]). For each panel, lines depict the mean values (± SEM; n = 12).
Figure 5
Figure 5
Absolute EEG delta, theta and sigma power in NREMS during the three first cycles of nighttime sleep in the PL condition. To quantify the nap effects on the subsequent nighttime sleep (EXP night) in the PL condition, absolute power derived from the average of 0.25 Hz bins included in the specific frequency range, i.e., delta (0.75-4.5 Hz), theta (4.75-8 Hz), and sigma (12-15 Hz), was calculated in the BLN and EXP nights (mean + 1SEM: n = 12). (A) Absolute delta power of NREMS during the 3 first cycles of the BLN and EXP nights for the PL condition differed significantly between nights and cycles (2-way mixed-model ANOVA: factors “night” P = 0.0038, “cycle” P < 0.0001, and their interaction P > 0.5). (B) As delta, absolute theta power of NREMS differed significantly between nights and cycles (2-way mixed-model ANOVA for factors “night” P = 0.007, “cycle” P < 0.0001, and their interaction P > 0.4) (C) Similar result for absolute sigma power of NREMS (2-way mixed-model ANOVA for factors “night” P = 0.0002, “cycle” P < 0.0001, and their interaction P > 0.1). For each panels, connected lines depict differences among cycles (1, 2, 3; Tukey-Kramer test P < 0.05) and between nights (BLN, EXP: paired t-test, P < 0.05).
Figure 6
Figure 6
EEG delta, theta, and sigma power in NREMS and EEG delta and theta power in REMS during the first three sleep cycles: drug treatment conditions vs. placebo. Relative EEG delta (0.75-4.5 Hz), theta (4.75-8 Hz), and sigma (12-15 Hz) power (mean ± SEM; n = 12) correspond to the EXP/BLN night ratio of each drug treatment condition expressed as a percentage of the EXP/BLN night ratio of the PL condition in the 3 first cycles of nighttime sleep. This illustrates the difference between each drug treatment condition and the PL condition for specific frequency ranges. (A, B, C) Only in the 1st cycle, the BAC-nap and SO-exp conditions showed increased relative delta and theta power and decreased relative sigma power compared to the PL condition, except for the BAC-exp condition which showed a significant increase of theta power in the 3rd cycle (1-way mixed-model ANOVA by cycle for factor “treatment” P < 0.05; Dunnett-Hsu test [control = PL] P < 0.05: star). (D) In REMS, compared to the PL condition, relative delta power for the SO-exp condition increased during the 1st cycle, while it increased for the BAC-exp condition during the 2nd cycle and 3rd cycle (one-way mixed-model ANOVA by cycle for factor “treatment” P < 0.05; Dunnett-Hsu test [control = PL] P < 0.05: star). (E) Relative theta power in REMS increased for the BAC-nap and SO-exp conditions during the 1st cycle and increased for the BAC-exp condition during the 2nd and 3rd cycles (for statistical tests see D).
Figure 7
Figure 7
Effects of nap with or without drug on sustained attention and subjective alertness. Objective measurement of cognitive performance was assessed by 10min psychomotor vigilance task (PVT) and subjective alertness by Karolinska Sleepiness Scale (KSS). (A) Mean and the 10% fastest reaction times (RT) are plotted for the trial performed 15 min before bedtime for the BLN and EXP nights (upper and middle panel, respectively). The 10% fastest RT were affected by the nap but not by treatment (2-way mixed-model ANOVA for factors “trial” P < 0.0001, “treatment” P = 1.0, and their interaction P > 0.1). A trend was also observed for the mean RT (factor “trial” P = 0.07). Black connected lines depict RT difference before the BLN and EXP nights (1-way mixed-model ANOVA for factor “time” by treatment; paired t-test P < 0.05). (B) Mean and the 10% fastest RT were plotted at 5 consecutive trials with the first trial performed just before the nap (hour 0) and the last trial just before the EXP night (hour 8). Generally, sustained attention was not affected by treatment, but was affected at the time the trial was carried out (for the 3 panels: 2-way mixed-model ANOVA for factors “time” P ≤ 0.0002, “treatment” P > 0.5, and their interaction P > 0.3). However, by analyzing each trial separately, SO treatment differed significantly from the 2 other treatments only at the trial just after the nap (1-way mixed-model ANOVA for factor “treatment” by trials; Tukey-Kramer test P < 0.05: black star). Colored connected lines show RTs, that are significantly different within the same treatment (Tukey-Kramer test P < 0.05): black: PL, blue: BAC and red: SO). (C) Although independently of the treatment, the KSS score was increased during the trial performed just before the EXP night compared to the trial performed just before the BLN night (2-way ANOVA for factors “trial” P = 0.001, “treatment” P > 0.6 and their interaction P > 0.1). Analysis done by treatment separately showed that only BAC treatment exhibited a significant increase of subjective alertness (black connected lines: 1-way mixed-model ANOVA for factor “time” by treatment; paired t-test P < 0.05). (D) Similar to results obtained with PVT, subjective alertness obtained by KSS was not generally affected by treatment, but by trial time (2-way mixed-model ANOVA for factors “time” P < 0.0001, “treatment” P > 0.1, and their interaction P = 0.9). Moreover, alertness after the nap was also transiently altered by SO compared to PL (red star: 1-way mixed-model ANOVA for factor “treatment” by trial; Tukey-Kramer test P < 0.05). However, this was not significantly different between SO and BAC treatments P > 0.1. For all panels, bars depict the mean values of each variable (mean ± SEM; n = 12-13).
Figure 8
Figure 8
SO and BAC do not affect global memory performance. Improvement in performance on the finger sequence tapping task (A), the unrelated word-pair learning task (B),and the 2-D face-location memory task (C) is shown for the 3 different treatments administered before the nap: BAC, SO, or PL. None of these tasks shown significant difference among treatments (1-way mixed-model ANOVA for “treatment” P > 0.05). For all panels, bars depict the mean values of each variable (mean +1SEM). Memory performance on the 3 tasks is calculated as percentage of performance at retrieval, with performance at encoding before the nap set to 100%.

Similar articles

Cited by

References

    1. U.S. Xyrem Multicenter Study Group. A 12-month, open-label, multicenter extension trial of orally administered sodium oxybate for the treatment of narcolepsy. Sleep. 2003;26:31–5. - PubMed
    1. Mamelak M, Black J, Montplaisir J, Ristanovic R. A pilot study on the effects of sodium oxybate on sleep architecture and daytime alertness in narcolepsy. Sleep. 2004;27:1327–34. - PubMed
    1. Van Cauter E, Plat L, Scharf MB, et al. Simultaneous stimulation of slow-wave sleep and growth hormone secretion by gamma-hydroxybutyrate in normal young men. J Clin Invest. 1997;100:745–53. - PMC - PubMed
    1. Lapierre O, Montplaisir J, Lamarre M, Bedard MA. The effect of gamma-hydroxybutyrate on nocturnal and diurnal sleep of normal subjects: further considerations on REM sleep-triggering mechanisms. Sleep. 1990;13:24–30. - PubMed
    1. Scharf MB, Baumann M, Berkowitz DV. The effects of sodium oxybate on clinical symptoms and sleep patterns in patients with fibromyalgia. J Rheumatol. 2003;30:1070–4. - PubMed

Publication types

MeSH terms