

Using bioinformatic approaches to identify pathways targeted by human leukemogens
- PMID: 22851955
- PMCID: PMC3407916
- DOI: 10.3390/ijerph9072479
Using bioinformatic approaches to identify pathways targeted by human leukemogens
Abstract
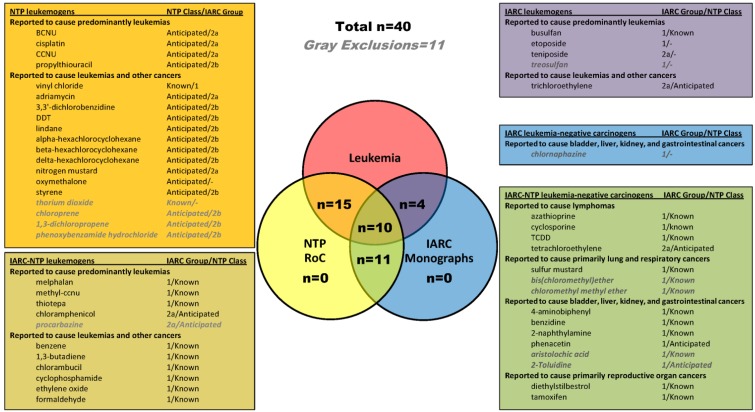
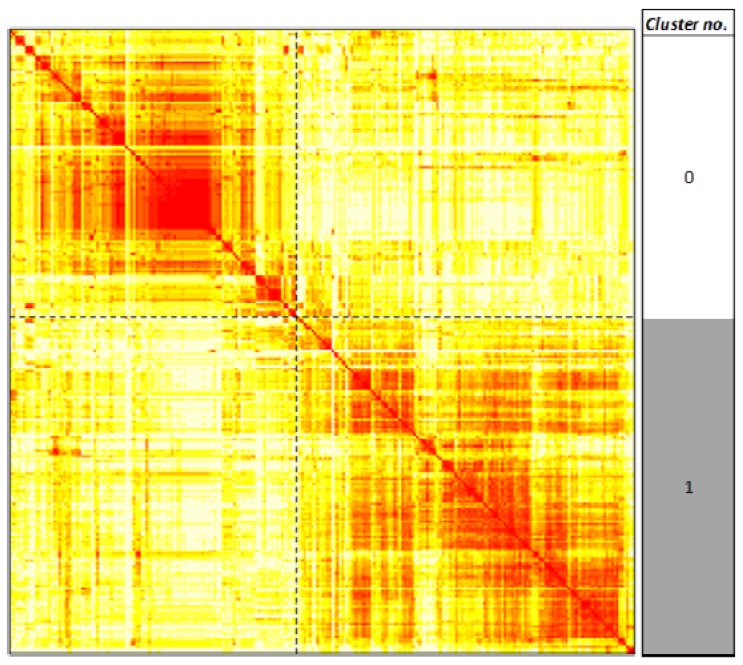
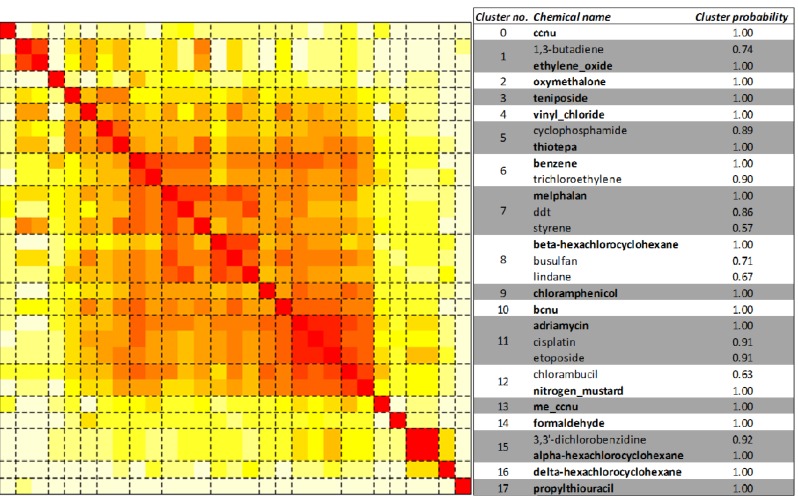
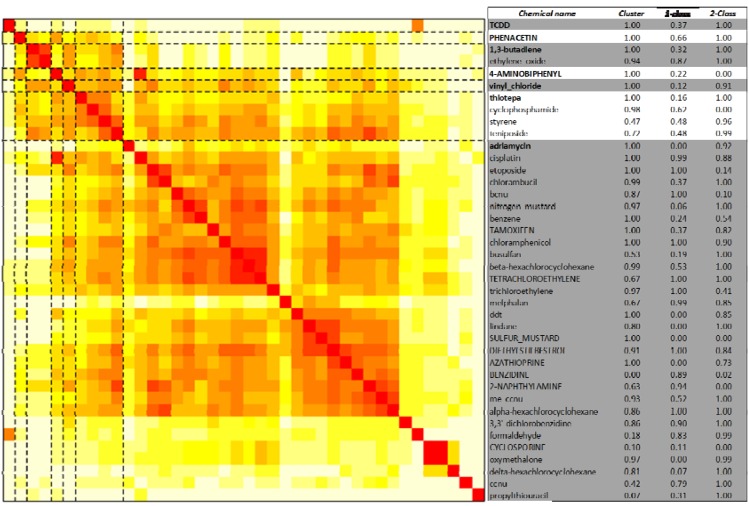
We have applied bioinformatic approaches to identify pathways common to chemical leukemogens and to determine whether leukemogens could be distinguished from non-leukemogenic carcinogens. From all known and probable carcinogens classified by IARC and NTP, we identified 35 carcinogens that were associated with leukemia risk in human studies and 16 non-leukemogenic carcinogens. Using data on gene/protein targets available in the Comparative Toxicogenomics Database (CTD) for 29 of the leukemogens and 11 of the non-leukemogenic carcinogens, we analyzed for enrichment of all 250 human biochemical pathways in the Kyoto Encyclopedia of Genes and Genomes (KEGG) database. The top pathways targeted by the leukemogens included metabolism of xenobiotics by cytochrome P450, glutathione metabolism, neurotrophin signaling pathway, apoptosis, MAPK signaling, Toll-like receptor signaling and various cancer pathways. The 29 leukemogens formed 18 distinct clusters comprising 1 to 3 chemicals that did not correlate with known mechanism of action or with structural similarity as determined by 2D Tanimoto coefficients in the PubChem database. Unsupervised clustering and one-class support vector machines, based on the pathway data, were unable to distinguish the 29 leukemogens from 11 non-leukemogenic known and probable IARC carcinogens. However, using two-class random forests to estimate leukemogen and non-leukemogen patterns, we estimated a 76% chance of distinguishing a random leukemogen/non-leukemogen pair from each other.
Keywords: Comparative Toxicogenomics Database; carcinogen; clustering; leukemogen; pathway.
Figures
Similar articles
-
Formaldehyde as a potential human leukemogen: an assessment of biological plausibility.Crit Rev Toxicol. 2006 Feb;36(2):135-53. doi: 10.1080/10408440500533208. Crit Rev Toxicol. 2006. PMID: 16736940 Review.
-
Estimating the incidence of leukemia attributable to occupational exposure in Iran.Asian Pac J Cancer Prev. 2009 Jan-Mar;10(1):67-70. Asian Pac J Cancer Prev. 2009. PMID: 19469627
-
Challenging the concept of de novo acute myeloid leukemia: Environmental and occupational leukemogens hiding in our midst.Blood Rev. 2021 May;47:100760. doi: 10.1016/j.blre.2020.100760. Epub 2020 Sep 22. Blood Rev. 2021. PMID: 32988660 Review.
-
Environmental and chemical carcinogenesis.Semin Cancer Biol. 2004 Dec;14(6):473-86. doi: 10.1016/j.semcancer.2004.06.010. Semin Cancer Biol. 2004. PMID: 15489140 Review.
-
Case study on the utility of hepatic global gene expression profiling in the risk assessment of the carcinogen furan.Toxicol Appl Pharmacol. 2014 Jan 1;274(1):63-77. doi: 10.1016/j.taap.2013.10.019. Epub 2013 Oct 29. Toxicol Appl Pharmacol. 2014. PMID: 24183702
Cited by
-
Correlation between p65 and TNF-α in patients with acute myelocytic leukemia.Oncol Lett. 2015 Nov;10(5):3305-3309. doi: 10.3892/ol.2015.3720. Epub 2015 Sep 17. Oncol Lett. 2015. PMID: 26722330 Free PMC article.
-
The Next Generation of Risk Assessment Multi-Year Study-Highlights of Findings, Applications to Risk Assessment, and Future Directions.Environ Health Perspect. 2016 Nov;124(11):1671-1682. doi: 10.1289/EHP233. Epub 2016 Apr 19. Environ Health Perspect. 2016. PMID: 27091369 Free PMC article. Review.
-
Analysis of the transcriptome in molecular epidemiology studies.Environ Mol Mutagen. 2013 Aug;54(7):500-17. doi: 10.1002/em.21798. Epub 2013 Aug 1. Environ Mol Mutagen. 2013. PMID: 23907930 Free PMC article. Review.
-
Design and experimental approach to the construction of a human signal-molecule-profiling database.Int J Environ Res Public Health. 2013 Dec 9;10(12):6887-908. doi: 10.3390/ijerph10126887. Int J Environ Res Public Health. 2013. PMID: 24351788 Free PMC article.
References
-
- Swerdlow S.H., Campo E., Harris N.L., Jaffe E.S., Pileri S.A., Stein H., Thiele J., Vardiman J.W. WHO Classification of Tumours of Haematopoietic and Lymphoid Tissues. IARC; Lyon, France: 2008.
-
- Cancer Facts & Figures 2012. American Cancer Society; Atlanta, GA, USA: 2012. American Cancer Society.
-
- Austin H., Delzell E., Cole P. Benzene and leukemia. A review of the literature and a risk assessment. Am. J. Epidemiol. 1988;127:419–439. - PubMed
Publication types
MeSH terms
Substances
Grants and funding
LinkOut - more resources
Full Text Sources
Medical
