

Risk-based classification of leukemia by cytogenetic and multiplex molecular methods: results from a multicenter validation study
- PMID: 22852047
- PMCID: PMC3408638
- DOI: 10.1038/bcj.2012.24
Risk-based classification of leukemia by cytogenetic and multiplex molecular methods: results from a multicenter validation study
Abstract
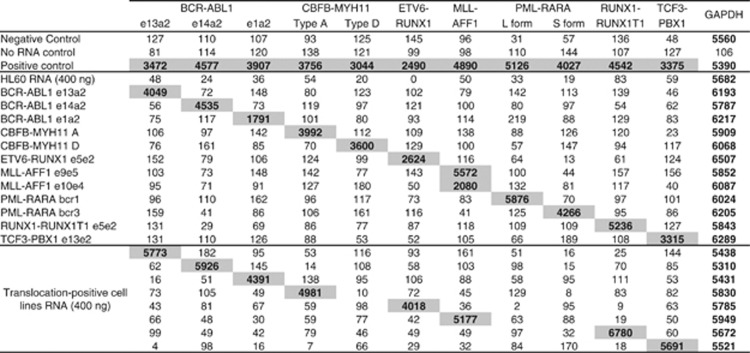
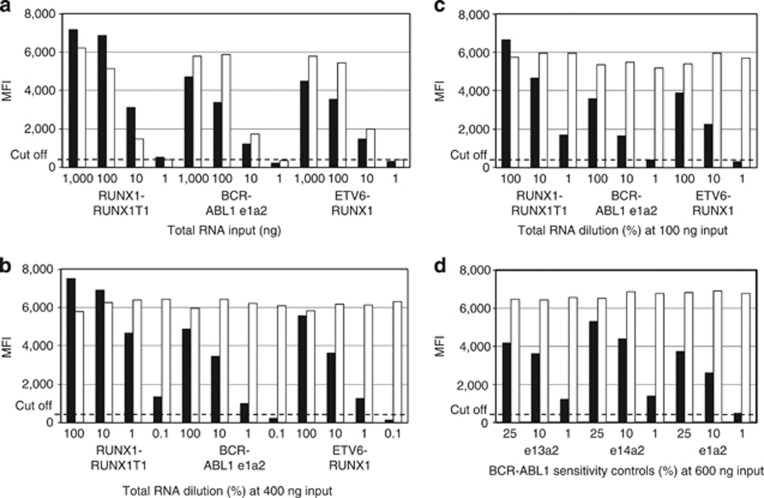
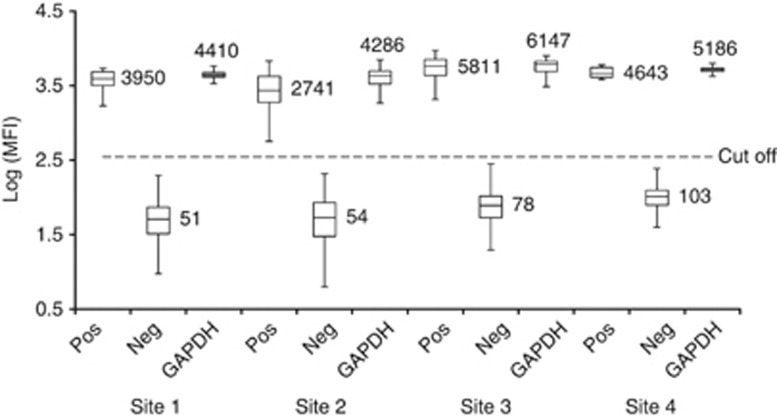
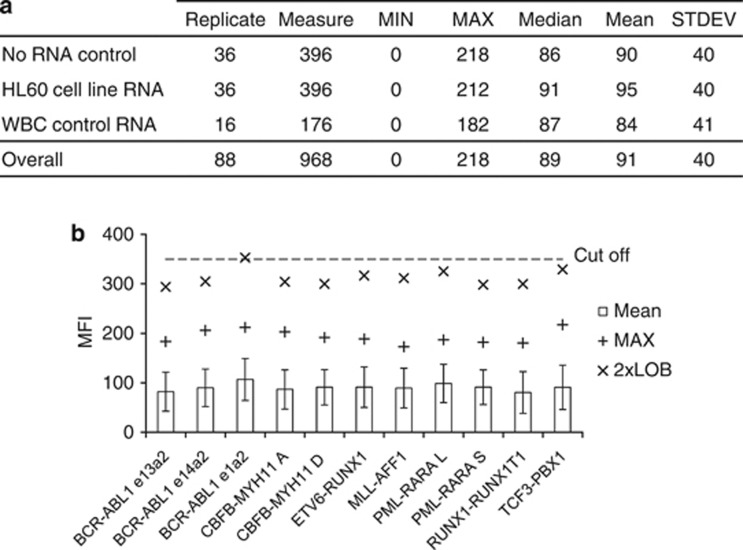
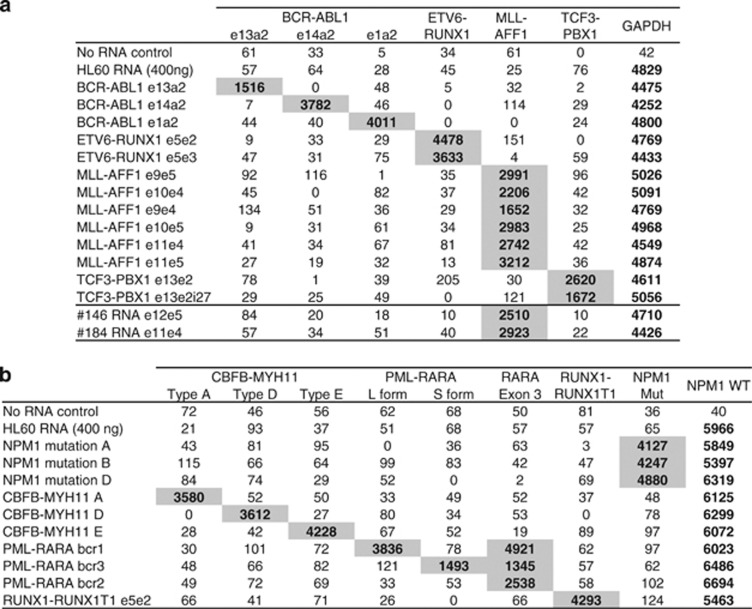
Modern management of leukemia and selection of optimal treatment approaches entails the analysis of multiple recurrent cytogenetic abnormalities with independent diagnostic or prognostic value. We report the first multicenter validation of a multiplex molecular assay for 12 relevant fusion transcripts relative to cytogenetic methods. Performance was evaluated using a set of 280 adult and pediatric acute or chronic leukemias representative of the variety of presentations and pre-analytical parameters encountered in the clinical setting. The positive, negative and overall agreements were >98.5% with high concordance at each of the four sites. Positive detection of cases with low blast count or at relapse was consistent with a method sensitivity of 1%. There was 98.7% qualitative agreement with independent reference molecular tests. Apparent false negatives corresponded to rare alternative splicing isoforms not included in the panel. We further demonstrate that clinical sensitivity can be increased by adding those rare variants and other relevant transcripts or submicroscopic abnormalities. We conclude that multiplex RT-PCR followed by liquid bead array detection is a rapid and flexible method attuned to the clinical laboratory workflow, complementing standard cytogenetic methods and generating additional information valuable for the accurate diagnosis, prognosis and subsequent molecular monitoring of leukemia.
Keywords: RT-PCR; diagnosis; leukemia; molecular classification; multiplex; prognosis.
Figures
Similar articles
-
An optimized technology platform for the rapid multiplex molecular analysis of genetic alterations associated with leukemia.Cancer Genet. 2012 Oct;205(10):488-500. doi: 10.1016/j.cancergen.2012.06.006. Epub 2012 Sep 29. Cancer Genet. 2012. PMID: 23026076 Free PMC article.
-
A multiplex reverse transcriptase-polymerase chain reaction strategy for the diagnostic molecular screening of chimeric genes: a clinical evaluation on 170 patients with acute lymphoblastic leukemia.Haematologica. 2003 Mar;88(3):275-9. Haematologica. 2003. PMID: 12651265
-
[Classical and molecular cytogenetic abnormalities in 124 pediatric patients with acute lymphoblastic leukemia].Zhonghua Er Ke Za Zhi. 2007 Sep;45(9):684-6. Zhonghua Er Ke Za Zhi. 2007. PMID: 18021563 Chinese.
-
Relapse and cytogenetic evolution in myeloid neoplasms.Panminerva Med. 2017 Dec;59(4):308-319. doi: 10.23736/S0031-0808.17.03380-8. Panminerva Med. 2017. PMID: 29144072 Review.
-
Detection of chromosomal translocations in leukemia-lymphoma cells by polymerase chain reaction.Leuk Lymphoma. 1995 Nov;19(5-6):359-80. doi: 10.3109/10428199509112194. Leuk Lymphoma. 1995. PMID: 8590836 Review.
Cited by
-
Bone Marrow Findings in Patients With Acute Promyelocytic Leukemia Treated With Arsenic Trioxide.Am J Clin Pathol. 2019 Oct 7;152(5):675-685. doi: 10.1093/ajcp/aqz087. Am J Clin Pathol. 2019. PMID: 31305869 Free PMC article.
-
Clinical advances in molecular biomarkers for cancer diagnosis and therapy.Int J Mol Sci. 2013 Jul 16;14(7):14771-84. doi: 10.3390/ijms140714771. Int J Mol Sci. 2013. PMID: 23863689 Free PMC article. Review.
-
An optimized technology platform for the rapid multiplex molecular analysis of genetic alterations associated with leukemia.Cancer Genet. 2012 Oct;205(10):488-500. doi: 10.1016/j.cancergen.2012.06.006. Epub 2012 Sep 29. Cancer Genet. 2012. PMID: 23026076 Free PMC article.
-
Diagnosis of fusion genes using targeted RNA sequencing.Nat Commun. 2019 Mar 27;10(1):1388. doi: 10.1038/s41467-019-09374-9. Nat Commun. 2019. PMID: 30918253 Free PMC article.
References
-
- Vardiman JW, Thiele J, Arber DA, Brunning RD, Borowitz MJ, Porwit A, et al. The 2008 revision of the World Health Organization (WHO) classification of myeloid neoplasms and acute leukemia: rationale and important changes. Blood. 2009;114:937–951. - PubMed
-
- Harrison CJ, Haas O, Harbott J, Biondi A, Stanulla M, Trka J, et al. Detection of prognostically relevant genetic abnormalities in childhood B-cell precursor acute lymphoblastic leukaemia: recommendations from the Biology and Diagnosis Committee of the International Berlin-Frankfurt-Munster study group. Br J Haematol. 2010;151:132–142. - PubMed
-
- Harrison CJ, Secker-Walker LM. The importance of cytogenetics and associated molecular techniques in the management of patients with leukaemia. Clin Oncol. 1998;10:255–261. - PubMed
-
- Pallisgaard N, Hokland P, Riishoj DC, Pedersen B, Jorgensen P. Multiplex reverse transcription-polymerase chain reaction for simultaneous screening of 29 translocations and chromosomal aberrations in acute leukemia. Blood. 1998;92:574–588. - PubMed
LinkOut - more resources
Full Text Sources
Research Materials
