

A multi-crystal wavelength dispersive x-ray spectrometer
- PMID: 22852678
- PMCID: PMC3422323
- DOI: 10.1063/1.4737630
A multi-crystal wavelength dispersive x-ray spectrometer
Abstract
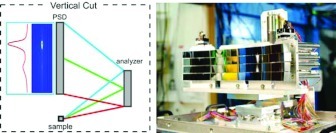
A multi-crystal wavelength dispersive hard x-ray spectrometer with high-energy resolution and large solid angle collection is described. The instrument is specifically designed for time-resolved applications of x-ray emission spectroscopy (XES) and x-ray Raman scattering (XRS) at X-ray Free Electron Lasers (XFEL) and synchrotron radiation facilities. It also simplifies resonant inelastic x-ray scattering (RIXS) studies of the whole 2d RIXS plane. The spectrometer is based on the Von Hamos geometry. This dispersive setup enables an XES or XRS spectrum to be measured in a single-shot mode, overcoming the scanning needs of the Rowland circle spectrometers. In conjunction with the XFEL temporal profile and high-flux, it is a powerful tool for studying the dynamics of time-dependent systems. Photo-induced processes and fast catalytic reaction kinetics, ranging from femtoseconds to milliseconds, will be resolvable in a wide array of systems circumventing radiation damage.
Figures


References
-
- Arthur J., Materlik G., Tatchyn R., and Winick H., “The LCLS - A 4th-generation light-source using the SLAC linac,” Rev. Sci. Instrum. 66(2), 1987–1989 (1995). 10.1063/1.1145778 - DOI
-
- Emma P., Akre R., Arthur J., Bionta R., Bostedt C., Bozek J., Brachmann A., Bucksbaum P., Coffee R., Decker F. J., Ding Y., Dowell D., Edstrom S., Fisher A., Frisch J., Gilevich S., Hastings J., Hays G., Hering P., Huang Z., Iverson R., Loos H., Messerschmidt M., Miahnahri A., Moeller S., Nuhn H. D., Pile G., Ratner D., Rzepiela J., Schultz D., Smith T., Stefan P., Tompkins H., Turner J., Welch J., White W., Wu J., Yocky G., and Galayda J., “First lasing and operation of an angstrom-wavelength free-electron laser,” Nat. Photonics 4(9), 641–647 (2010). 10.1038/nphoton.2010.176 - DOI
-
- Glatzel P. and Bergmann U., “High resolution 1s core hole x-ray spectroscopy in 3d transition metal complexes - electronic and structural information,” Coord. Chem. Rev. 249(1–2), 65–95 (2005). 10.1016/j.ccr.2004.04.011 - DOI
-
- Bergmann U., Glatzel P., and Cramer S. P., “Bulk-sensitive XAS characterization of light elements: From x-ray Raman scattering to x-ray Raman spectroscopy,” Microchem. J. 71(2–3), 221–230 (2002). 10.1016/S0026-265X(02)00014-0 - DOI
-
- Nordgren J., Bray G., Cramm S., Nyholm R., Rubensson J. E., and Wassdahl N., “Soft-x-ray emission-spectroscopy using monochromatized synchrotron radiation,” Rev. Sci. Instrum. 60(7), 1690–1696 (1989). 10.1063/1.1140929 - DOI
Publication types
MeSH terms
Grants and funding
LinkOut - more resources
Full Text Sources