. 2012 Aug 1:5:26.
doi: 10.1186/1756-6606-5-26.

Upregulation of transmitter release probability improves a conversion of synaptic analogue signals into neuronal digital spikes

Affiliations

Upregulation of transmitter release probability improves a conversion of synaptic analogue signals into neuronal digital spikes

Jiandong Yu et al. Mol Brain. .

Abstract

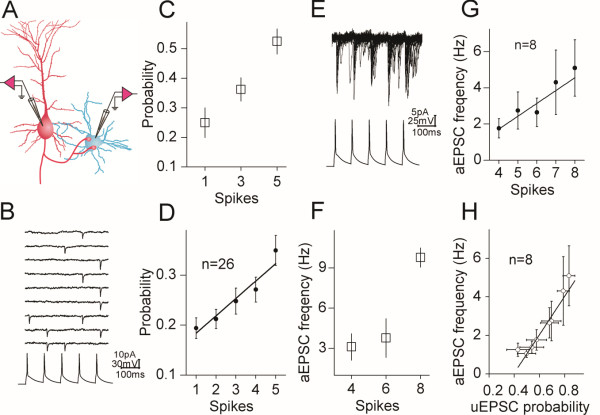
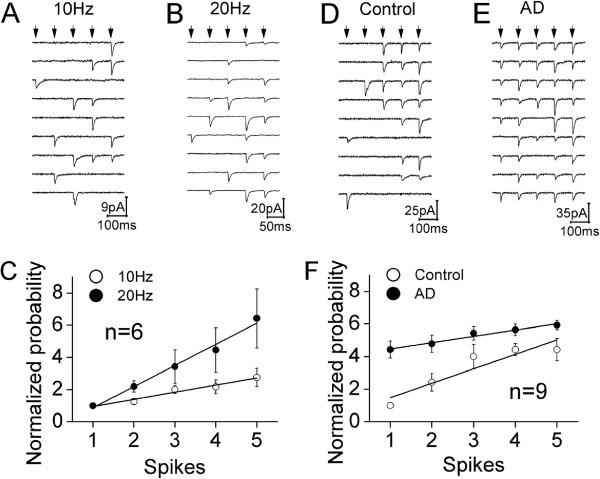
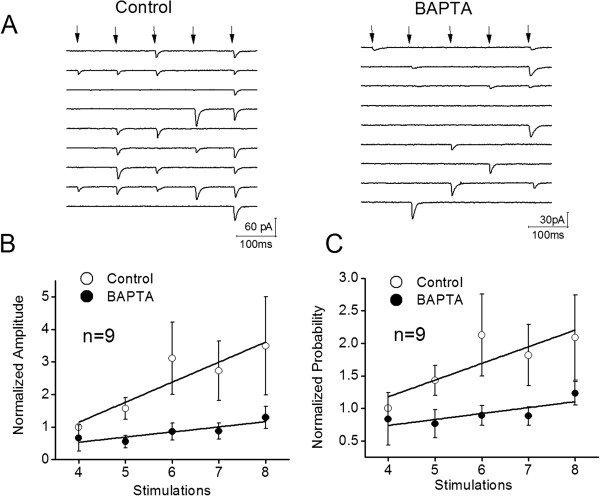
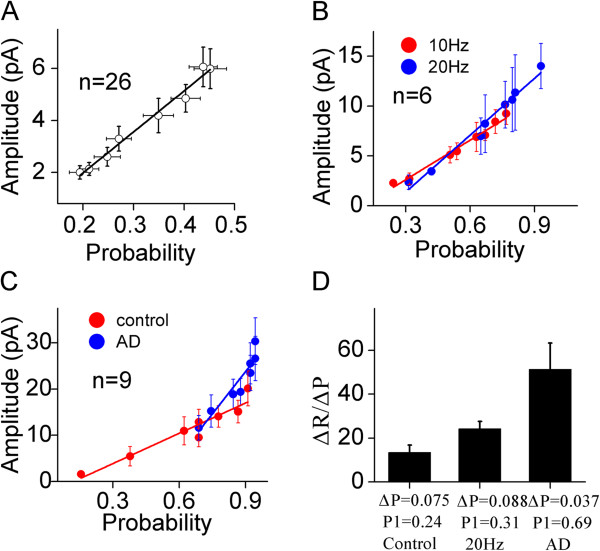
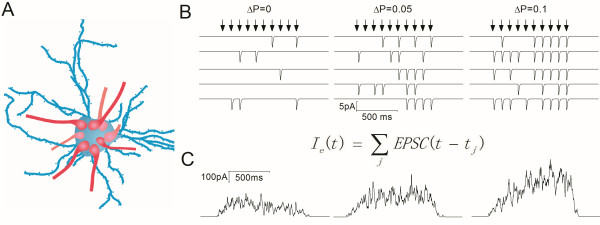
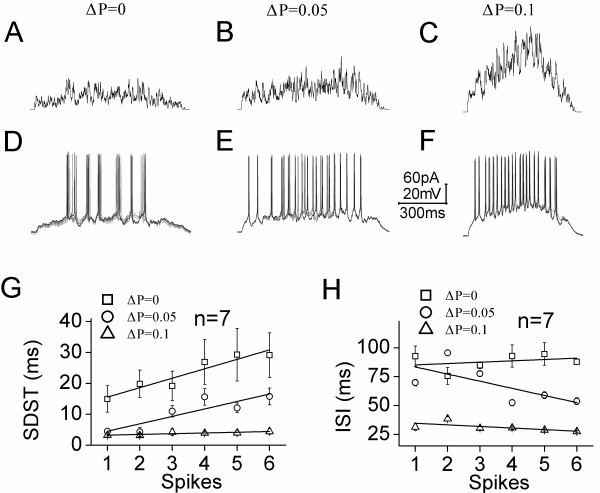
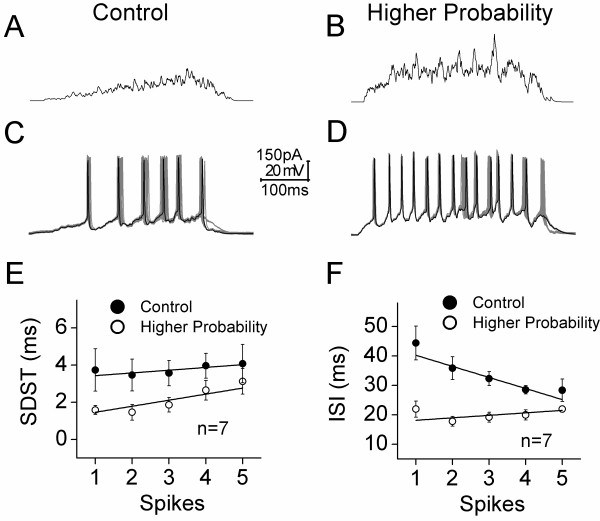
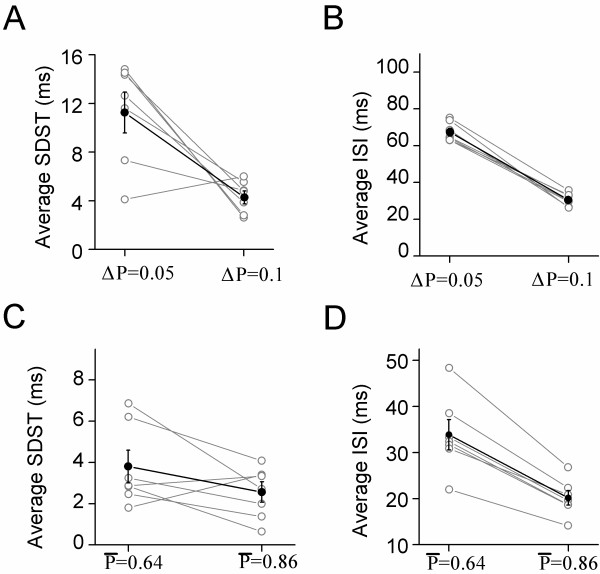
Action potentials at the neurons and graded signals at the synapses are primary codes in the brain. In terms of their functional interaction, the studies were focused on the influence of presynaptic spike patterns on synaptic activities. How the synapse dynamics quantitatively regulates the encoding of postsynaptic digital spikes remains unclear. We investigated this question at unitary glutamatergic synapses on cortical GABAergic neurons, especially the quantitative influences of release probability on synapse dynamics and neuronal encoding. Glutamate release probability and synaptic strength are proportionally upregulated by presynaptic sequential spikes. The upregulation of release probability and the efficiency of probability-driven synaptic facilitation are strengthened by elevating presynaptic spike frequency and Ca2+. The upregulation of release probability improves spike capacity and timing precision at postsynaptic neuron. These results suggest that the upregulation of presynaptic glutamate release facilitates a conversion of synaptic analogue signals into digital spikes in postsynaptic neurons, i.e., a functional compatibility between presynaptic and postsynaptic partners.


Figures

Figure 1
Figure 1
The probability of releasing glutamates increases during sequential presynaptic spikes in a linearly correlated manner. A) shows a diagram for the pair-recording of uEPSCs at unitary synapses from a pyramidal neuron to a GABAergic cell. B) shows synaptic responses evoked by five sequential spikes in a low glutamate release probability. Top traces show the superimposed traces of uEPSCs at a synapse, and a trace in bottom is sequential spikes evoked in presynaptic neuron. C) illustrates the averaged data of spikes vs. their corresponding release probability at this synapse. D) illustrates the averaged data of spikes vs. their corresponding release probability at other synapses (n = 26). E) shows the superimposed traces of uEPSCs and subsequent aEPSCs induced by sequential spikes 4 ~ 8 at a synapse. F) illustrates the averaged data of spikes vs. their corresponding aEPSCs frequency at this synapse. G) shows the averaged data of spikes versus their corresponding aEPSCs frequency at other synapses (n = 8). H) shows a plot of linear correlation between uEPSC1 ~ 8 amplitudes and their corresponding aEPSCs frequency (n = 8). Lines in E~F illustrate linear dynamical fitting.
Figure 2
Figure 2
The probability of releasing glutamates is up-regulated by spike frequency and presynaptic Ca2+. A) shows the waveforms of uEPSC1 ~ 5 induced by five sequential spikes (arrows) with 10 Hz in frequency at a synapse. Calibration bar, 9 pA/100 ms. B) shows the waveforms of uEPSC1 ~ 5 induced by five sequential spikes (arrows) with 20 Hz in frequency at this synapse. Calibration bar, 20 pA/50 ms. C) shows the comparisons of the normalized probabilities of releasing glutamates by five spikes in frequencies at 10 Hz (opened symbols) vs. 20 Hz (filled symbols; n = 6). D) shows the waveforms of uEPSC1 ~ 5 induced by five sequential spikes (arrows) under the control at a synapse. Calibration bar, 25 pA/100 ms. E) shows the waveforms of uEPSC1 ~ 5 induced by five sequential spikes (arrows) under adenophostin-A (AD) infusion at a synapse. Calibration bar, 35 pA/100 ms. F) shows the comparisons of the normalized probabilities of releasing glutamates by five spikes under control (opened symbols) vs. AD infusion (filled symbols; n = 9). Lines in C and F illustrate linear dynamical fitting.
Figure 3
Figure 3
The reduction of presynaptic Ca2+ by infusing BAPTA attenuates the increment of release probability of glutamate release and the facilitation of synaptic transmission. A) Left panel shows the waveforms of uEPSC4 ~ 8 induced by sequential spikes (pointed by arrows) at a synapse under control. Calibration bar, 60 pA/100 ms. Right panel shows the waveforms of uEPSC4 ~ 8 induced by these sequential spikes (arrows) at this synapse under BAPTA infusion. Calibration bar, 30 pA/100 ms. B) shows the normalized uEPSC amplitudes under the conditions of control (opened symbols) versus BAPTA infusion (filled symbols; n = 10). C) shows the normalized probabilities of releasing glutamate under the conditions of control (opened symbols) versus BAPTA infusion (filled symbols; n = 10). It is noteworthy that the experiments were done at the synapses with low probability, such that uEPSC4 ~ 8 were analyzed. Lines in B and C illustrate linear dynamical fitting.
Figure 4
Figure 4
Presynaptic Ca2+ enhances an efficiency of probability-driven facilitation. A) shows a linear correlation between the probability of releasing glutamate and the amplitude of unitary synaptic responses (uEPSCs). B) shows the comparisons of linear correlations between release probability and uEPSCs induced by eight spikes at 10 Hz (red symbols) and 20 Hz (blues, n = 6). The efficiency of probability-driven facilitation is high when presynaptic spikes are 20 Hz. C) shows the comparisons of linear correlations between release probability and uEPSCs induced by eight spikes under control (red-filled symbols) and adenophostin-A infusion (blues, n = 9). The efficiency of probability-driven facilitation is high when presynaptic Ca2+ is elevated by AD infusion. D) A plot shows the ratios of changes in uEPSCs to release probability vs. the levels of release probability, i.e., the higher release probability is, the higher efficiency of probability-driven facilitation. Lines in A ~ C illustrate linear dynamical fitting.
Figure 5
Figure 5
A principle for the integration of synaptic inputs on postsynaptic neurons by computational simulation. A) A neuron receives many synaptic inputs. B) These synapses in response to presynaptic manipulations possess the different changes in release probability (ΔP). The arrows present the firing of presynaptic spikes. C) shows the integrated current waveforms under the conditions of different release probabilities, based on the formula.
Figure 6
Figure 6
The high increment of release probability during sequential presynaptic spikes enhances the capacity and precision of spike encodings at postsynaptic GABAergic cells. A-C) show the integrated signals from unitary glutamatergic synapses under the conditions of release probability increments (ΔP) about 0, 0.05 and 0.1. D-F) show spike patterns induced by the integrated signals from unitary synapses under the conditions of release probability increments (ΔP) about 0, 0.05 and 0.1. G) shows the comparisons of standard deviation of spike timing (SDST) versus spikes under the conditions of release probability increments (ΔP) about 0 (square symbols), 0.05 (circles) and 0.1 (triangles, n = 7). H) shows the comparisons of inter-spike intervals (ISI) versus spikes under the conditions of release probability increments (ΔP) about 0 (square symbols), 0.05 (circles) and 0.1 (triangles). Calibration bars are 60 pA, 20 mV and 300 ms. Lines in G ~ H illustrate linear dynamical fitting.
Figure 7
Figure 7
Higher release probability during sequential presynaptic spikes enhances the capacity and precision of spike encodings at postsynaptic GABAergic neurons. A-B) show the integrated signals from unitary glutamatergic synapses under the conditions of control (A) and adenophostin-A infusion (B, higher probability). C-D) illustrate spike patterns induced by the integrated signals from unitary glutamatergic synapses under the conditions of control (C) and AD infusion (D, higher probability) G) shows the comparisons of standard deviation of spike timing (SDST) vs. spikes under the conditions of control (filled symbols) and AD infusion (higher probability, opened symbols; n = 7). H) illustrates the comparisons of inter-spike intervals (ISI) vs. spikes under the conditions of control (filled symbols) and AD infusion (higher probability, opened symbols; n = 7). Calibration bars are 150 pA, 20 mV and 100 ms. Lines in E ~ F illustrate linear dynamical fitting.
Figure 8
Figure 8
Release probability increment and higher release probability enhance spike encodings at postsynaptic GABAergic neurons. A) The higher increment of release probability during presynaptic sequential spikes reduces SDST. B) The higher increment of release probability during presynaptic sequential spikes reduces ISI. C) The higher release probability reduces SDST. D) The higher release probability reduces ISI.

Similar articles

Cited by

References

    1. Kandel ER, Siegelbaum SA, Schwartz JH. In: Principles of Neural Science. Kandel ER, Schwartz JH, Jessell TM, editor. New York: McGraw-Hill; 2000. Elementary interactions between neurons: Synaptic transmission; pp. 175–308.
    1. Shepherd GM. In: Neurobiology. Shepherd GM, editor. New York: Oxford University Press; 1998. Synaptic transmission.
    1. Abbott LF, Regehr WG. Synaptic computation. Nature. 2004;431:796–802. doi: 10.1038/nature03010. - DOI - PubMed
    1. Azous R, Gray CM. Dynamic spike threshold reveals a mechanism for synaptic coincidence detection in cortical neurons in vivo. Proc Natl Acad Sci U S A. 2000;97:8110–8115. doi: 10.1073/pnas.130200797. - DOI - PMC - PubMed
    1. Byrne JH. Learning and Memory: Basic Mechanisms. Amsterdam: Academic Press; 2003.

Publication types

LinkOut - more resources