. 2012 Aug 22;134(33):13700-7.
doi: 10.1021/ja3034526. Epub 2012 Aug 10.

Direct simulation of early-stage Sec-facilitated protein translocation

Affiliations

Direct simulation of early-stage Sec-facilitated protein translocation

Bin Zhang et al. J Am Chem Soc. .

Abstract

Direct simulations reveal key mechanistic features of early-stage protein translocation and membrane integration via the Sec-translocon channel. We present a novel computational protocol that combines non-equilibrium growth of the nascent protein with microsecond timescale molecular dynamics trajectories. Analysis of multiple, long timescale simulations elucidates molecular features of protein insertion into the translocon, including signal-peptide docking at the translocon lateral gate (LG), large lengthscale conformational rearrangement of the translocon LG helices, and partial membrane integration of hydrophobic nascent-protein sequences. Furthermore, the simulations demonstrate the role of specific molecular interactions in the regulation of protein secretion, membrane integration, and integral membrane protein topology. Salt-bridge contacts between the nascent-protein N-terminus, cytosolic translocon residues, and phospholipid head groups are shown to favor conformations of the nascent protein upon early-stage insertion that are consistent with the Type II (N(cyt)/C(exo)) integral membrane protein topology, and extended hydrophobic contacts between the nascent protein and the membrane lipid bilayer are shown to stabilize configurations that are consistent with the Type III (N(exo)/C(cyt)) topology. These results provide a detailed, mechanistic basis for understanding experimentally observed correlations between integral membrane protein topology, translocon mutagenesis, and nascent-protein sequence.


Figures

Figure 1
Figure 1
Early-stage protein insertion into the Sec translocon. (Middle Panel) The all-atom system employed in the MD simulations, including the translocon (gray surface, with the helices TM2b and TM7 in green, the pore residues in orange, and the plug moiety in violet), the truncated SecA protein (white surface), and the nascent protein undergoing insertion (yellow, blue, red). (Top Panel) Expanded view of the interface region between SecA and the translocon, with the two nascent protein insertion points (IP1 and IP2) indicated. The SecA two-helix-finger and β-sheet domains are indicated in light green and light blue, respectively, and the nascent protein residues are presented with same color scheme as in the middle panel. (Bottom Panel) Schematic illustration of the simulation protocol used to model non-equilibrium protein insertion. The translocon is shown in gray, with the LG region indicated in green, the pore residues in orange, and the plug moiety in violet. SecA is shown in white, and the nascent-protein sequence is shown using the same coloring scheme as in the middle panel. Each period of nascent-protein growth is followed by a microsecond-timescale trajectory at fixed protein length.
Figure 2
Figure 2
Structural features of the nascent protein and translocon at various times along the insertion trajectories T1 and T2. The translocon is shown in gray surface, with the two LG helices in green, the pore residues in orange and the plug moiety in violet. The nascent-protein SP and the hydrophobic mature domain of the nascent protein are colored in blue, while the hydrophilic mature domain is colored in red.
Figure 3
Figure 3
Translocon LG width profiles along trajectories T1 and T2. (A) Illustration of the LG width profile, which is indicated with red arrows. The coordinate associated with the channel axis is indicated at left. (B) The LG width profiles for trajectories T1 (blue) and T2 (red) at various times. The data at time 0.5 μs is repeated in the dashed black curve. (C) The difference in the LG width profiles between trajectories T1 and T2.
Figure 4
Figure 4
Early stage membrane integration. (A, B) Representative configurations from trajectories T1 and T2 after t = 3.5 μs of simulation time. The nascent-protein residues (hydrophobic in blue, hydrophilic in red) and the translocon LG helices (green) are shown in atomistic detail. The density field for the hydrophobic lipid tails is projected onto the xy plane, with gray indicating low density and white for high density. The orange circles indicate positions that are 18 Å from the center of the channel axis. (C) The time-evolution of the number of nascent-protein residues, formula image
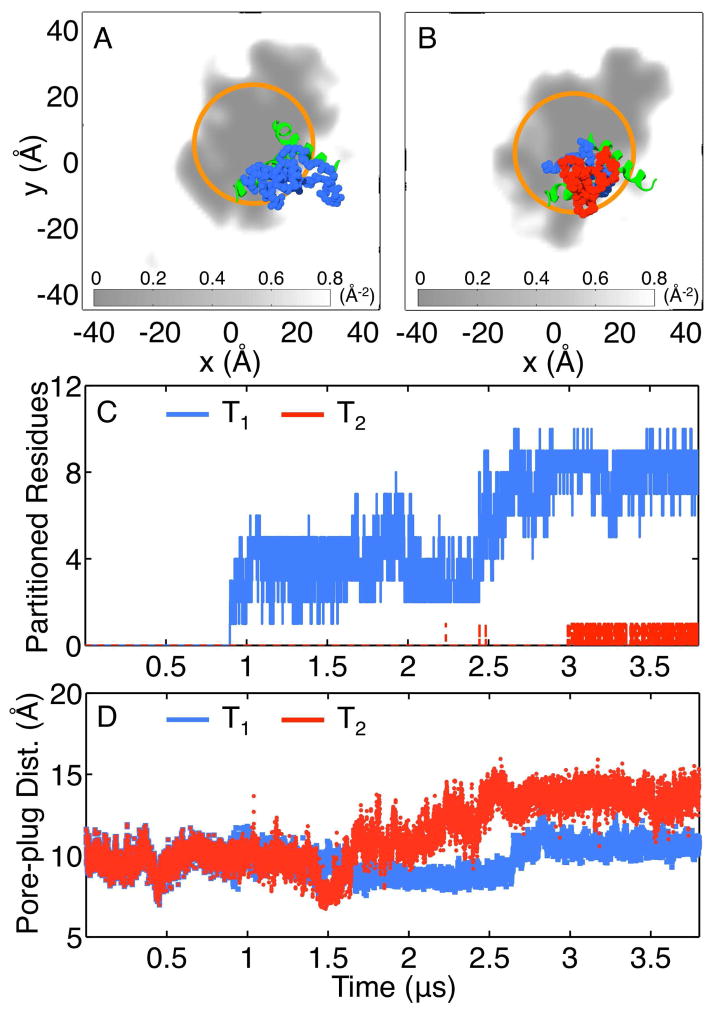
, that partition into the membrane during the insertion simulations. (D) The time-evolution of the pore-plug distance in the insertion simulations.
Figure 5
Figure 5
The SP adopts configurations that differ with respect to orientation, secondary structure, and solvation environment along the simulated insertion trajectories T1 and T3. (A, B) The conformation of the nascent protein in trajectories T1 (part A) and in trajectory T3 (part B). The nascent protein is presented in blue, with the N-terminal residue highlighted in yellow. The translocon is shown as a gray surface. (C, D) Formation of the hydrophobic interface between the SP (blue) and the lipid bilayer. Water within 8 Å of the SP is shown as a light blue surface. (E) The hydrophobic contact area between the SP and the surrounding lipid molecules, plotted as a function of time in trajectories T1 (blue) and T3 (red).
Figure 6
Figure 6
Formation of salt bridges involving the N-terminus of the nascent protein. (A) Representative configurations associated with salt bridges that are observed in the insertion trajectories. The SP is shown in blue, with its Arg residue shown in the space-filling representation. The translocon is shown in white ribbon, with the two LG helices in green. The negatively charged residues on the translocon are shown in yellow, and the lipid head-groups are shown in orange and red. (B) The time-evolution of the salt bridges formed during trajectories T2 (red) and T3 (blue).

Similar articles

Cited by

References

    1. Wickner W, Schekman R. Science. 2005;310:1452–1456. - PubMed
    1. Rapoport TA. Nature. 2007;450:663–669. - PubMed
    1. Driessen AJM, Nouwen N. Annu Rev Biochem. 2008;77:643–667. - PubMed
    1. Duong F, Wickner W. EMBO J. 1998;17:696–705. - PMC - PubMed
    1. Heinrich SU, Mothes W, Brunner J, Rapoport TA. Cell. 2000;102:233–244. - PubMed

Publication types

MeSH terms

Substances