. 2012 Aug 1:13:361.
doi: 10.1186/1471-2164-13-361.

Quantitative RNA-Seq analysis in non-model species: assessing transcriptome assemblies as a scaffold and the utility of evolutionary divergent genomic reference species

Affiliations

Quantitative RNA-Seq analysis in non-model species: assessing transcriptome assemblies as a scaffold and the utility of evolutionary divergent genomic reference species

Emily A Hornett et al. BMC Genomics. .

Abstract

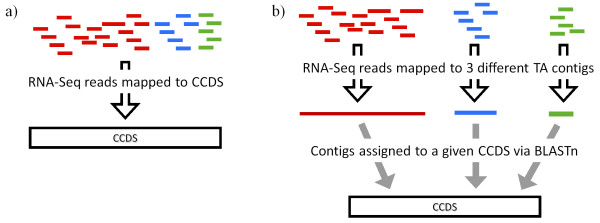
Background: How well does RNA-Seq data perform for quantitative whole gene expression analysis in the absence of a genome? This is one unanswered question facing the rapidly growing number of researchers studying non-model species. Using Homo sapiens data and resources, we compared the direct mapping of sequencing reads to predicted genes from the genome with mapping to de novo transcriptomes assembled from RNA-Seq data. Gene coverage and expression analysis was further investigated in the non-model context by using increasingly divergent genomic reference species to group assembled contigs by unique genes.

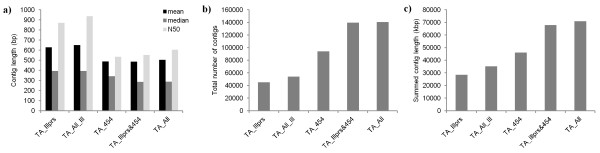
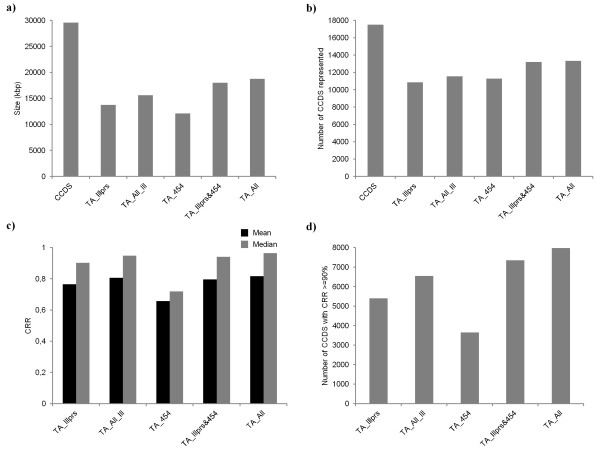
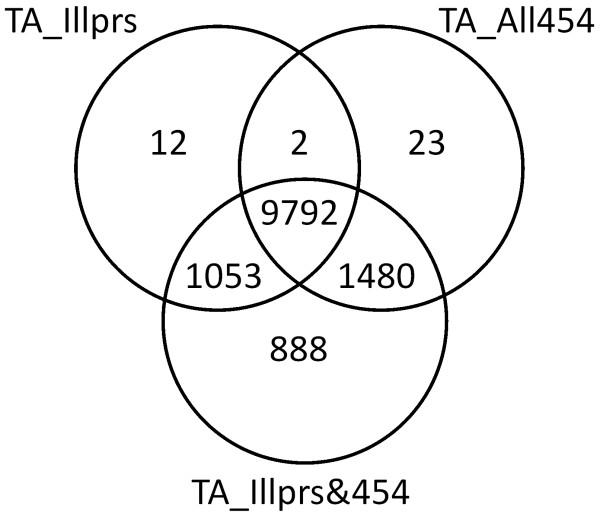
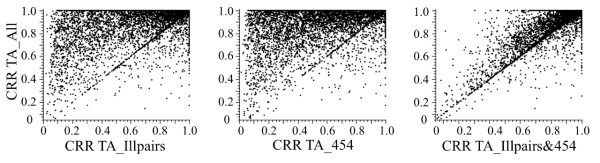
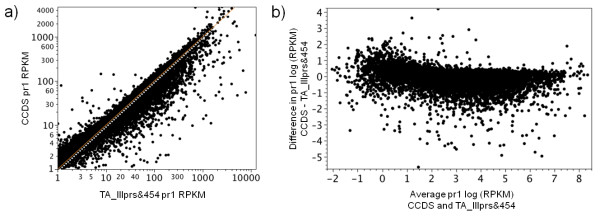
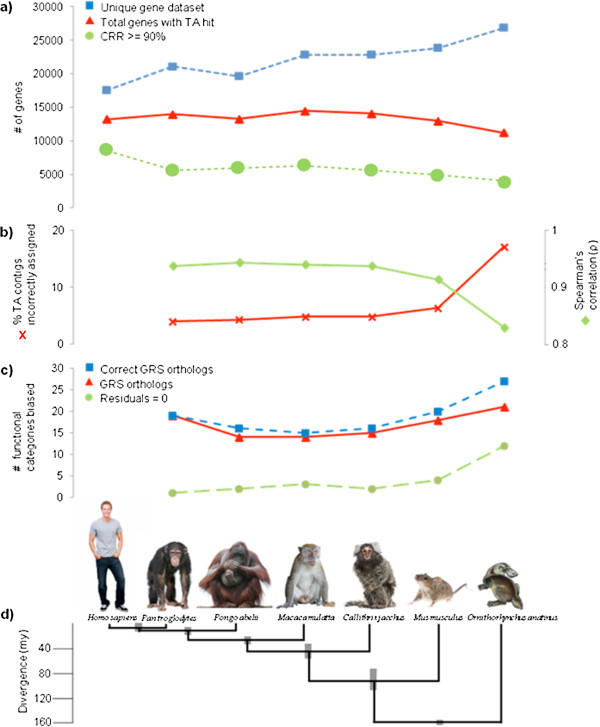
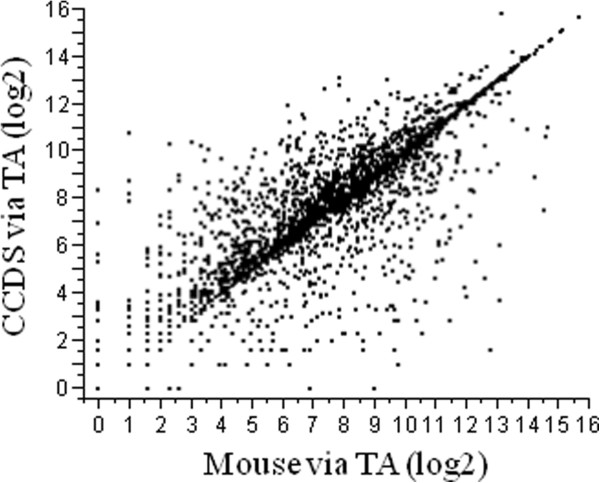
Results: Eight transcriptome sets, composed of varying amounts of Illumina and 454 data, were assembled and assessed. Hybrid 454/Illumina assemblies had the highest transcriptome and individual gene coverage. Quantitative whole gene expression levels were highly similar between using a de novo hybrid assembly and the predicted genes as a scaffold, although mapping to the de novo transcriptome assembly provided data on fewer genes. Using non-target species as reference scaffolds does result in some loss of sequence and expression data, and bias and error increase with evolutionary distance. However, within a 100 million year window these effect sizes are relatively small.

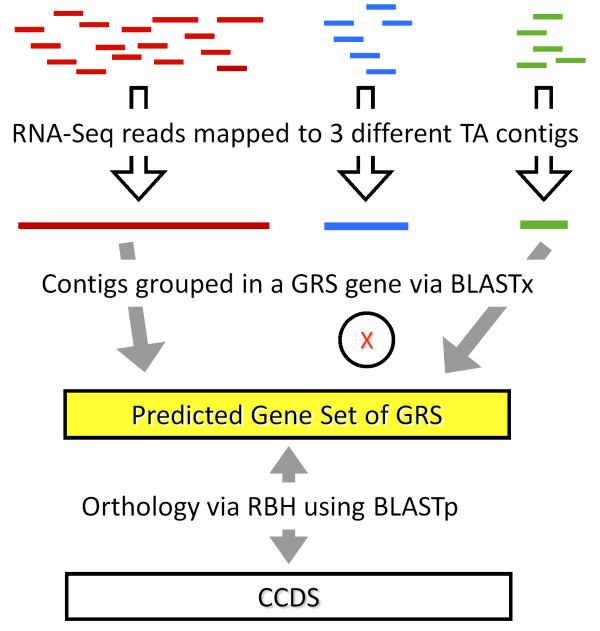
Conclusions: Predicted gene sets from sequenced genomes of related species can provide a powerful method for grouping RNA-Seq reads and annotating contigs. Gene expression results can be produced that are similar to results obtained using gene models derived from a high quality genome, though biased towards conserved genes. Our results demonstrate the power and limitations of conducting RNA-Seq in non-model species.


Figures

Figure 1
Figure 1
Basic assembly metrics of five de novo transcriptome assemblies (TAs). Comparison of the assembly metrics for five TAs generated from different data sources: a) the mean, median and N50 TA contig length, b) the total number of contigs in the TA, and c) the summed contig length.
Figure 2
Figure 2
Assessment of TA quality using genomic information. a) the total size (kbp) of the TAs compared to the CCDS, adjusted so only the contig sequence that aligns to a CCDS is included; b) the total number of genes represented in each TA compared to the CCDS; c) the mean and median CRR (coverage of CCDS) in a TA; and d) the number of CCDS transcripts that have equal or greater than 90% CRR in the TA.
Figure 3
Figure 3
Venn diagram displaying the numbers of CCDS transcripts represented in each of three TAs.
Figure 4
Figure 4
Comparison of the coverage (CRR) of the de novo TAs. The best quality transcriptome produced (TA_All) and three other TAs created using RNA-Seq from different sequencing methods were compared: panel of three graphs depicting the CRR of CCDS that are represented in all three TAs, each datapoint (black dots) represents the CRR of a CCDS.
Figure 5
Figure 5
Diagram of the two methods used to assign RNA-Seq reads to CCDS. a) RNA-Seq reads are mapped directly to the CCDS dataset, b) RNA-Seq reads are mapped to a TA and then the TA contigs assigned to CCDS via BLASTn.
Figure 6
Figure 6
Comparison of the RNA-Seq expression levels produced from different mapping methods. a) Y axis shows the RPKM values when reads are mapped directly to the CCDS, X-axis shows the RPKM values when mapping the same CCDS genes via the TA_Illprs&454 scaffold. Method for mapping via TAs is showing in Figure 5b. b) Y axis shows the number of differences between RNA-Seq reads mapped (in RPKM) either directly to the CCDS or via the TA_Illprs&454 scaffold [log(CCDS) – log(TA_Illprs&454 scaffold)]. X-axis shows the average of the log RPKM for CCDS genes using the two mapping methods.
Figure 7
Figure 7
Overview of the non-model species RNA-Seq mapping strategy for inferring ‘gene’ grouping of RNA-Seq read data. Displayed are RNA-Seq reads that are mapped to three different TA contigs. The red and green contigs (DNA) are assigned to the same gene of the GRS (protein) via BlastX. However, due to divergence between the target species and the genomic reference species (GRS), the blue contig is not, resulting in only the red and green RNA-Seq reads being assigned to this GRS ortholog. In order to compare the expression data inferred from these GRS groupings to that obtained by directly mapping RNA-Seq reads to the CCDS genes, the orthology between GRS and CCDS genes was determined using the Reciprocal Best Hit (RBH) via BLASTp. This method can be compared to the method outlined in Figure 5b.
Figure 8
Figure 8
Assessment of error and bias using increasingly divergent genomic reference species as proxies. a) Number of genes in different datasets derived using either H. sapiens, or each of the six species evolutionarily divergent from H. sapiens as the genomic reference. Lines are as follows: Blue square - the total number of genes in the filtered species dataset; Red triangle - the number of genes that have TA contig hits; Green circle - Number of genes with CRR > = 90%; b) Blue diamond - Comparison of the Spearman’s correlation (ρ) for expression values obtained through annotating TA contigs using the CCDS dataset and using the proxy GRS datasets; Red squares - Level of error incurred through using divergent GRS to annotate TA measured as the percentage of TA contigs incorrectly assigned to CCDS; c) Bias obtained through using GRS as proxy datasets (number of GO and/or KEGG categories): Red triangles - GRS genes orthologous to human CCDS genes; Blue squares - subset of the GRS orthologs that have only TA contigs that are correctly assigned to them; Green circles - residuals from a graph of expression values obtained via mapping to the TA and then annotated either directly to the CCDS or to a GRS gene set. Significance is at p < 0.05 in all cases; d) Approximate divergence times of proxy GRS from H. sapiens (taken from [30-33].
Figure 9
Figure 9
Quantiative gene expression results comparing results from direct mapping vs. using a Mouse proxy. Comparison of expression levels (log2) between genes identified via BLASTn of TA contigs and the H. sapiens CCDS dataset (Y-axis), and genes identified first via BLASTx of TA contigs and the Mouse dataset, and then BLASTp RBH of Mouse dataset and the Human dataset (X-axis). Each point represents a CCDS gene. Points above line of unity include genes that lose contigs through no hit in the Mouse dataset.

References

    1. Nagalakshmi U, Wang Z, Waern K, Shou C, Raha D, Gerstein M, Snyder M. The transcriptional landscape of the yeast genome defined by RNA sequencing. Science. 2008;320:1344–1349. doi: 10.1126/science.1158441. - DOI - PMC - PubMed
    1. Marguerat S, Bähler J. RNA-seq: from technology to biology. Cellular and molecular life sciences. 2010;67:569–579. doi: 10.1007/s00018-009-0180-6. - DOI - PMC - PubMed
    1. Trapnell C, Williams B, Pertea G, Mortazavi A, Kwan G, van Baren MJ, Salzberg S, Wold BJ, Pachter L. Transcript assembly and quantification by RNA-Seq reveals unannotated transcripts and isoform switching during cell differentiation. Nature Biotechnology. 2010;28:511–515. doi: 10.1038/nbt.1621. - DOI - PMC - PubMed
    1. Fontanillas P, Landry C, Wittkopp P, Russ C, Gruber J, Nusbaum C, Hartl D. Key considerations for measuring allelic expression on a genomic scale using high-throughput sequencing. Mol Ecol. 2010;19:212–227. - PMC - PubMed
    1. Creighton CJ, Reid JG, Gunaratne PH. Expression profiling of microRNAs by deep sequencing. Brief Bioinform. 2009;10:490–497. doi: 10.1093/bib/bbp019. - DOI - PMC - PubMed

Publication types

LinkOut - more resources