

High-dose cholecalciferol reduces parathyroid hormone in patients with early chronic kidney disease: a pilot, randomized, double-blind, placebo-controlled trial
- PMID: 22854402
- PMCID: PMC3417221
- DOI: 10.3945/ajcn.112.040642
High-dose cholecalciferol reduces parathyroid hormone in patients with early chronic kidney disease: a pilot, randomized, double-blind, placebo-controlled trial
Abstract
Background: Vitamin D deficiency contributes to secondary hyperparathyroidism, which occurs early in chronic kidney disease (CKD).
Objectives: We aimed to determine whether high-dose cholecalciferol supplementation for 1 y in early CKD is sufficient to maintain optimal vitamin D status (serum 25-hydroxyvitamin D [25(OH)D] concentration ≥30 ng/mL) and decrease serum parathyroid hormone (PTH). A secondary aim was to determine the effect of cholecalciferol on blood pressure and serum fibroblast growth factor-23 (FGF23).
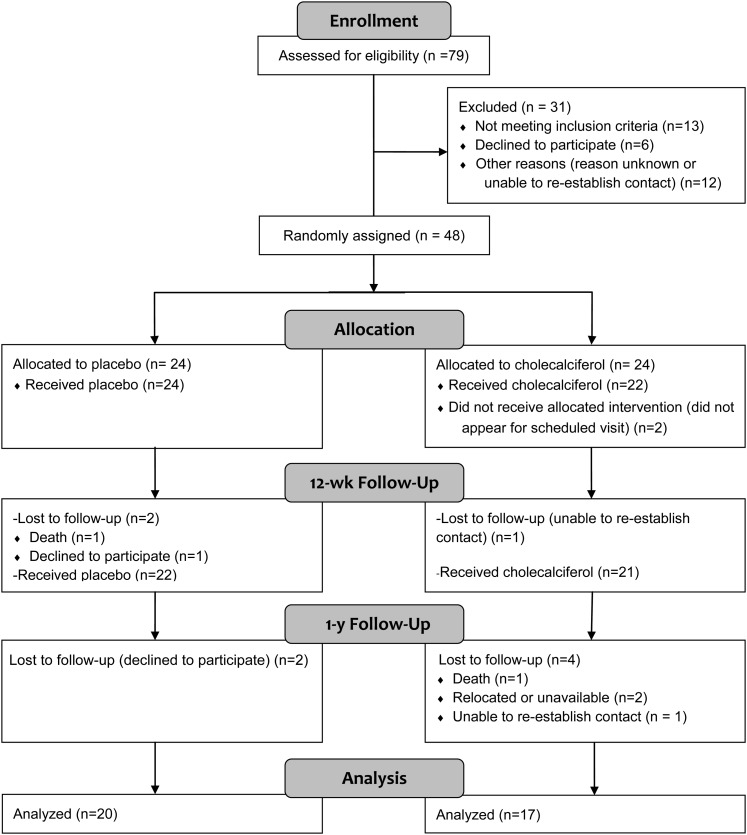
Design: This was a double-blind, randomized, placebo-controlled trial. Forty-six subjects with early CKD (stages 2-3) were supplemented with oral cholecalciferol (vitamin D group; 50,000 IU/wk for 12 wk followed by 50,000 IU every other week for 40 wk) or a matching placebo for 1 y.
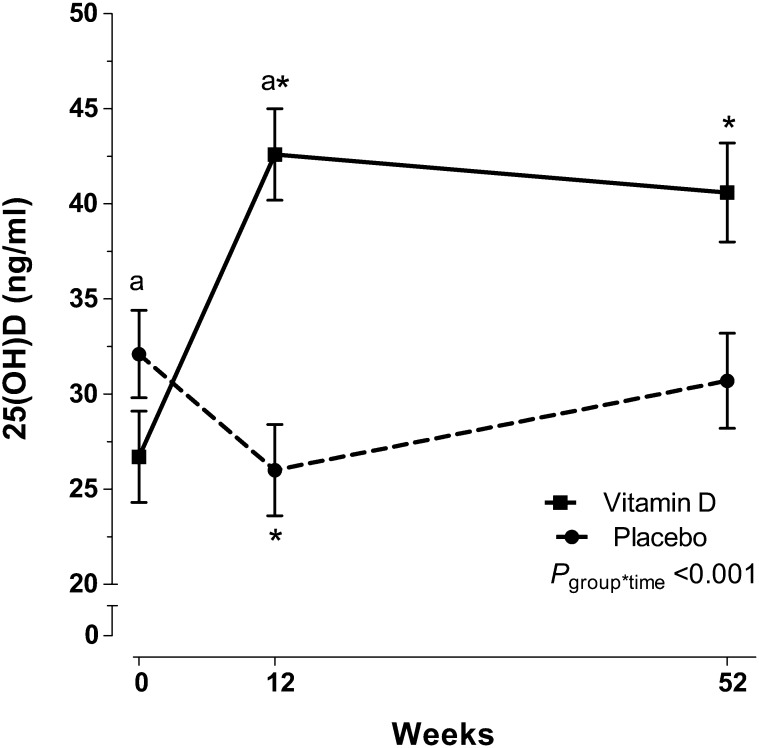
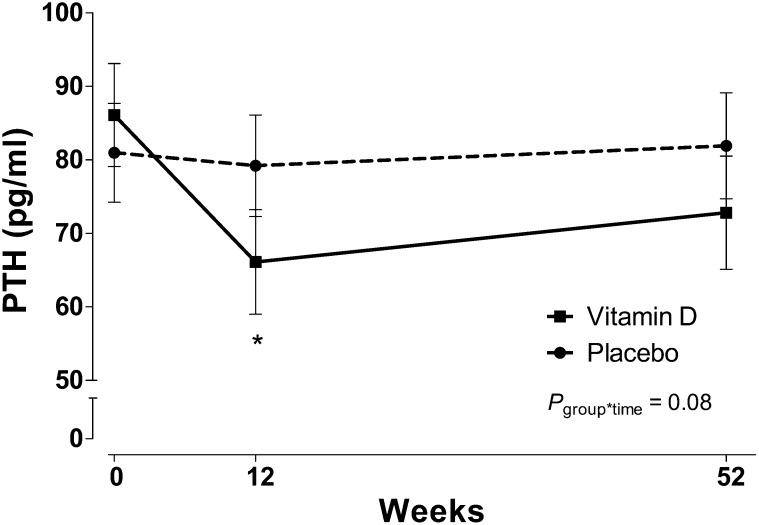
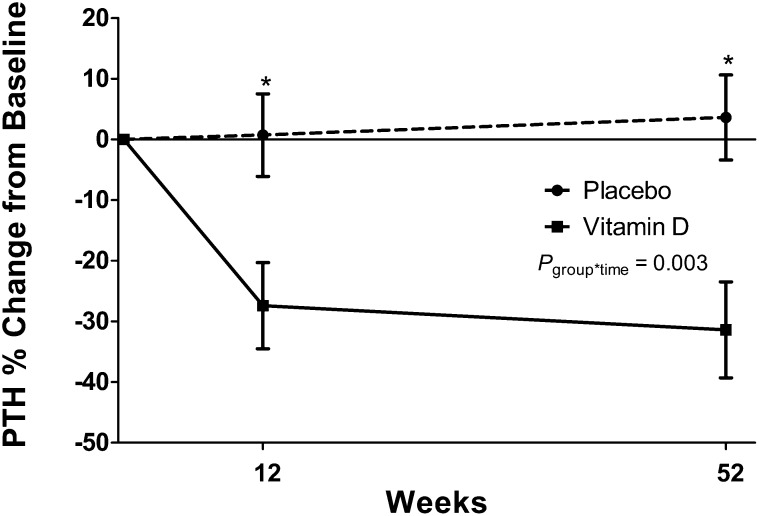
Results: By 12 wk, serum 25(OH)D increased in the vitamin D group only [baseline (mean ± SD): 26.7 ± 6.8 to 42.8 ± 16.9 ng/mL; P < 0.05] and remained elevated at 1 y (group-by-time interaction: P < 0.001). PTH decreased from baseline only in the vitamin D group (baseline: 89.1 ± 49.3 to 70.1 ± 24.8 pg/mL; P = 0.01) at 12 wk, but values were not significantly different from baseline at 1 y (75.4 ± 29.5 pg/mL; P = 0.16; group-by-time interaction: P = 0.09). Group differences were more pronounced in participants with secondary hyperparathyroidism (group-by-time interaction: P = 0.004). Blood pressure and FGF23 did not change in either group.
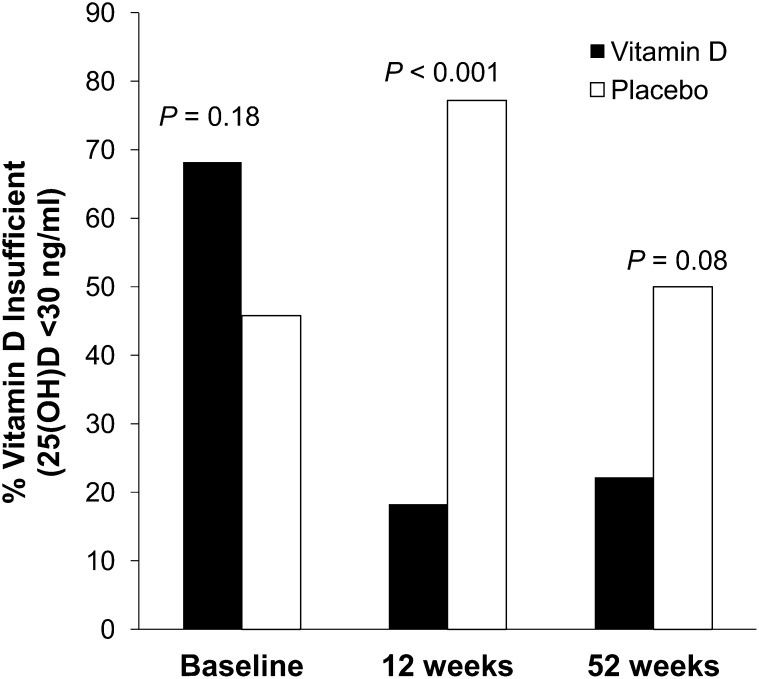
Conclusions: After 1 y, this oral cholecalciferol regimen was safe and sufficient to maintain serum 25(OH)D concentrations and prevent vitamin D insufficiency in early CKD. Furthermore, serum PTH improved after cholecalciferol treatment, particularly in patients who had secondary hyperparathyroidism.
Trial registration: ClinicalTrials.gov NCT00427037.
Figures
Similar articles
-
Cholecalciferol v. ergocalciferol for 25-hydroxyvitamin D (25(OH)D) repletion in chronic kidney disease: a randomised clinical trial.Br J Nutr. 2016 Dec;116(12):2074-2081. doi: 10.1017/S000711451600427X. Epub 2017 Jan 9. Br J Nutr. 2016. PMID: 28065190 Free PMC article. Clinical Trial.
-
Vitamin D supplementation in obese type 2 diabetes subjects in Ajman, UAE: a randomized controlled double-blinded clinical trial.Eur J Clin Nutr. 2015 Jun;69(6):707-11. doi: 10.1038/ejcn.2014.251. Epub 2014 Nov 19. Eur J Clin Nutr. 2015. PMID: 25406966 Free PMC article. Clinical Trial.
-
Cholecalciferol (vitamin D3) therapy and vitamin D insufficiency in patients with chronic kidney disease: a randomized controlled pilot study.Endocr Pract. 2008 Jan-Feb;14(1):10-7. doi: 10.4158/EP.14.1.10. Endocr Pract. 2008. PMID: 18238736 Free PMC article. Clinical Trial.
-
Vitamin D in Chronic Kidney Disease and Dialysis Patients.Nutrients. 2017 Mar 25;9(4):328. doi: 10.3390/nu9040328. Nutrients. 2017. PMID: 28346348 Free PMC article. Review.
-
Parathyroid function in chronic kidney disease: role of FGF23-Klotho axis.Contrib Nephrol. 2013;180:110-23. doi: 10.1159/000346791. Epub 2013 May 3. Contrib Nephrol. 2013. PMID: 23652554 Review.
Cited by
-
Inflammation and ER stress downregulate BDH2 expression and dysregulate intracellular iron in macrophages.J Immunol Res. 2014;2014:140728. doi: 10.1155/2014/140728. Epub 2014 Dec 1. J Immunol Res. 2014. PMID: 25762501 Free PMC article.
-
Effectiveness of Native Vitamin D Therapy in Patients with Chronic Kidney Disease Stage 3 and Hypovitaminosis D in Colombia, South America.Int J Nephrol Renovasc Dis. 2019 Dec 6;12:241-250. doi: 10.2147/IJNRD.S214194. eCollection 2019. Int J Nephrol Renovasc Dis. 2019. PMID: 31827333 Free PMC article.
-
Effects of Oral Multi-Vitamin Multi-Mineral Supplement Formulations on Laboratory Outcomes and Quality of Life: A Quasi-Experimental Study.Front Nutr. 2022 Jun 27;9:889910. doi: 10.3389/fnut.2022.889910. eCollection 2022. Front Nutr. 2022. PMID: 35832047 Free PMC article.
-
Meta-analysis of long-term vitamin D supplementation on overall mortality.PLoS One. 2013 Dec 3;8(12):e82109. doi: 10.1371/journal.pone.0082109. eCollection 2013. PLoS One. 2013. PMID: 24349197 Free PMC article.
-
The role of vitamin D in regulating the iron-hepcidin-ferroportin axis in monocytes.J Clin Transl Endocrinol. 2014 Mar 21;1(1):19-25. doi: 10.1016/j.jcte.2014.01.003. J Clin Transl Endocrinol. 2014. PMID: 25097830 Free PMC article.
References
-
- Couser WG, Remuzzi G, Mendis S, Tonelli M. The contribution of chronic kidney disease to the global burden of major noncommunicable diseases. Kidney Int 2011;80:1258–70 - PubMed
-
- Levin A, Bakris GL, Molitch M, Smulders M, Tian J, Williams LA, Andress DL. Prevalence of abnormal serum vitamin D, PTH, calcium, and phosphorus in patients with chronic kidney disease: results of the study to evaluate early kidney disease. Kidney Int 2007;71:31–8 - PubMed
-
- Cunningham J, Locatelli F, Rodriguez M. Secondary hyperparathyroidism: pathogenesis, disease progression, and therapeutic options. Clin J Am Soc Nephrol 2011;6:913–21 - PubMed
-
- Llach F, Velasquez Forero F. Secondary hyperparathyroidism in chronic renal failure: pathogenic and clinical aspects. Am J Kidney Dis 2001;38(5 suppl 5):S20–33 - PubMed
Publication types
MeSH terms
Substances
Associated data
Grants and funding
LinkOut - more resources
Full Text Sources
Other Literature Sources
Medical
