. 2012 Sep 28;287(40):33883-96.
doi: 10.1074/jbc.M111.309666. Epub 2012 Aug 1.

Znt7-null mice are more susceptible to diet-induced glucose intolerance and insulin resistance

Affiliations

Znt7-null mice are more susceptible to diet-induced glucose intolerance and insulin resistance

Liping Huang et al. J Biol Chem. .

Abstract

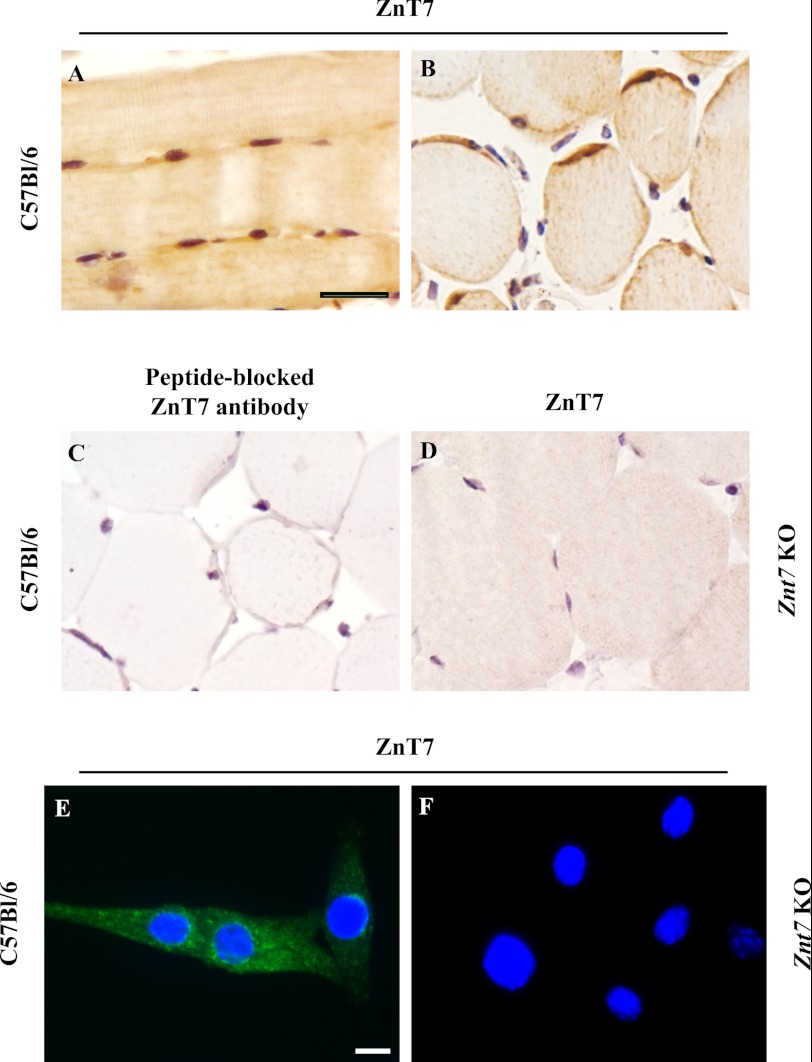
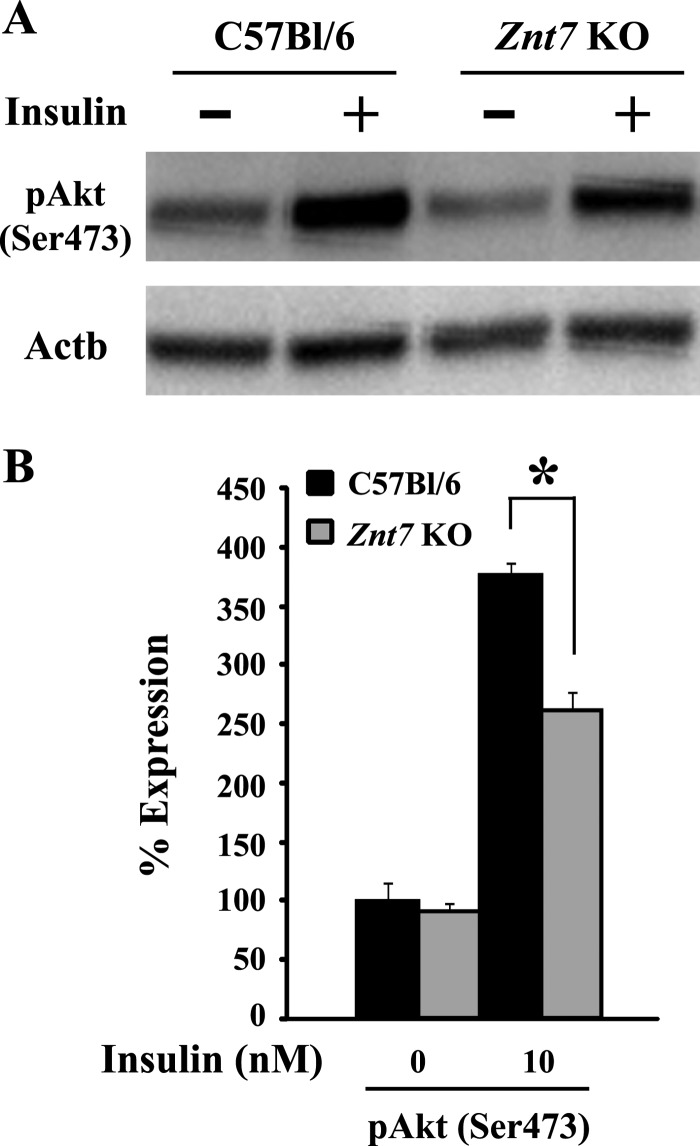
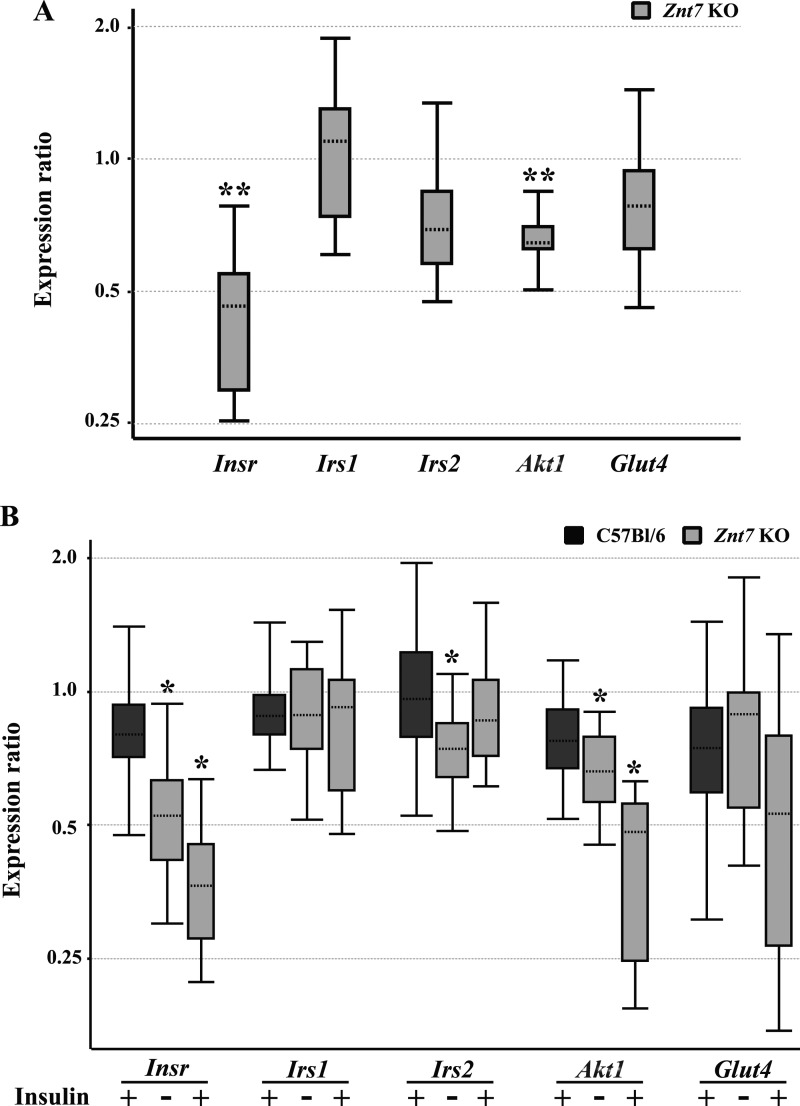
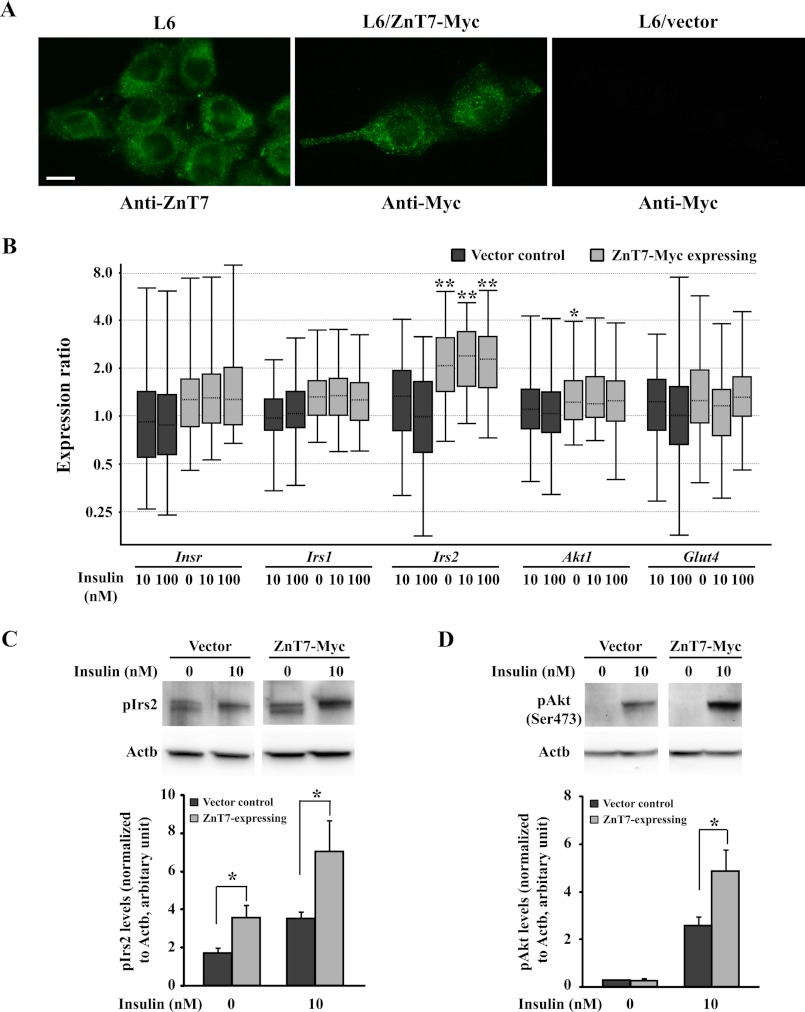
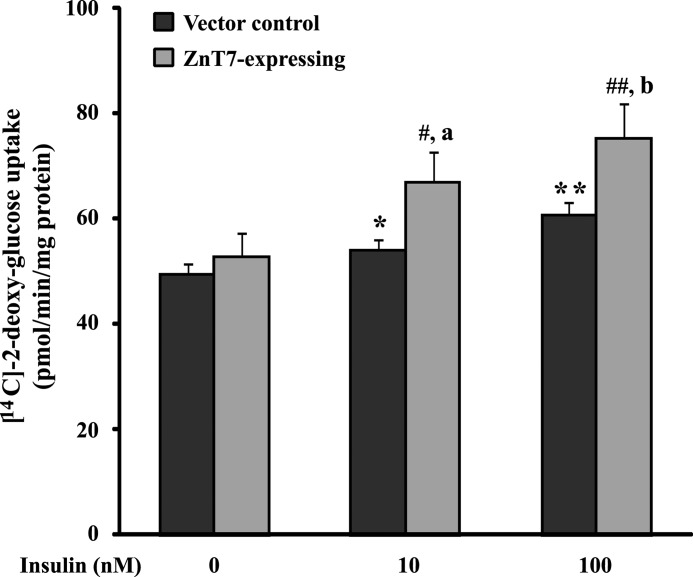
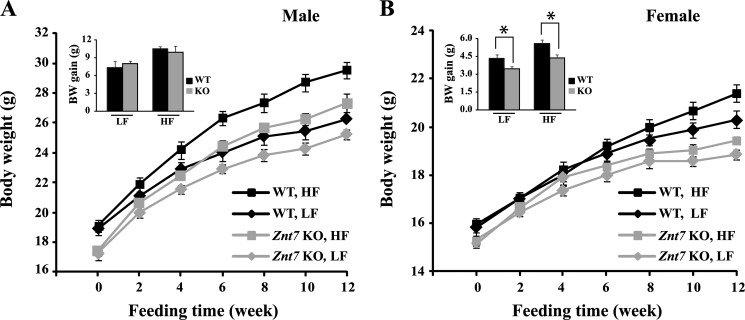
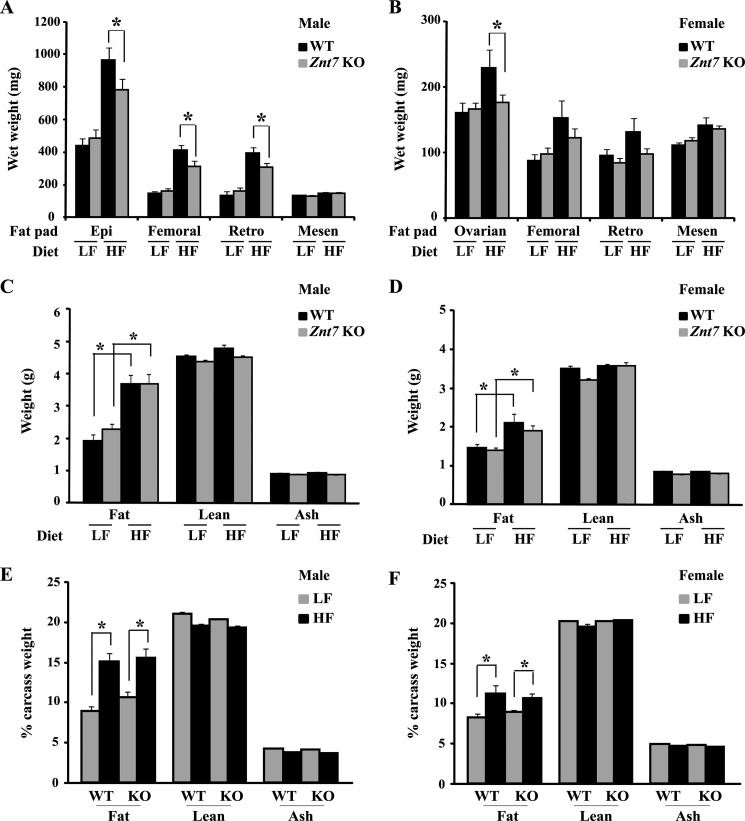
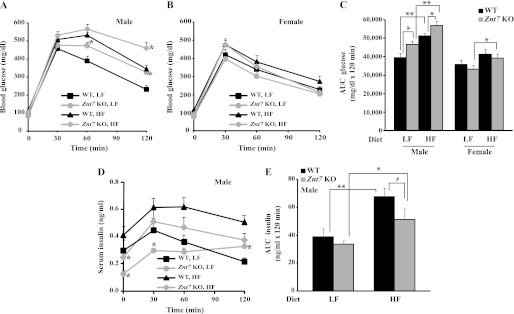
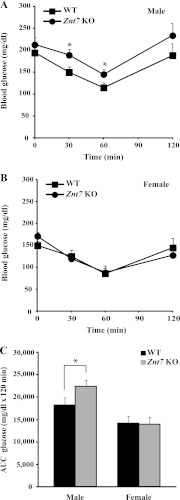
The Znt7 gene encodes a ubiquitously expressed zinc transporter that is involved in transporting cytoplasmic zinc into the Golgi apparatus and a ZnT7-containing vesicular compartment. Overexpression of ZnT7 in the pancreatic β-cell stimulates insulin synthesis and secretion through regulation of insulin gene transcription. In this study, we demonstrate that ZnT7 is expressed in the mouse skeletal muscle. The activity of the insulin signaling pathway was down-regulated in myocytes isolated from the femoral muscle of Znt7 knock-out (KO) mice. High fat diet consumption (45% kcal) induced weight gain in male Znt7 KO mice but not female Znt7 KO mice. Male Znt7 KO mice fed the high fat diet at 5 weeks of age for 10 weeks exhibited hyperglycemia in the non-fasting state. Oral glucose tolerance tests revealed that male Znt7 KO mice fed the high fat diet had severe glucose intolerance. Insulin tolerance tests showed that male Znt7 KO mice were insulin-resistant. Diet-induced insulin resistance in male Znt7 KO mice was paralleled by a reduction in mRNA expression of Insr, Irs2, and Akt1 in the primary skeletal myotubes isolated from the KO mice. Overexpression of ZnT7 in a rat skeletal muscle cell line (L6) increased Irs2 mRNA expression, Irs2 and Akt phosphorylation, and glucose uptake. We conclude that a combination of decreased insulin secretion and increased insulin resistance accounts for the glucose intolerance observed in Znt7 KO mice.


Figures

FIGURE 1.
FIGURE 1.
Expression of ZnT7 in mouse skeletal muscles. Femoral muscles were isolated from male C57Bl/6 and Znt7 KO mice. Muscles were fixed, embedded, sectioned, and immunostained with either an affinity-purified polyclonal antibody against ZnT7 or a peptide-blocked ZnT7 antibody. A, longitudinal section; B–D, cross-sections. A, B, and D, muscle fibers were immunostained with the ZnT7 antibody (1:750 dilution); C, muscle fibers were immunostained with the peptide-blocked ZnT7 antibody (1:750 dilution). Black scale bar, 25 μm. C57Bl/6 (E) and Znt7 KO (F) myoblasts were grown in a slide chamber coated with collagen for 48 h before staining. Cells were fixed, permeabilized, and immunostained with the ZnT7 antibody. Immunofluorescent staining of ZnT7 (green) was detected in the cytoplasm of myoblasts. The nuclei of myoblasts (blue) are indicated by the DAPI staining. White scale bar, 10 μm.
FIGURE 2.
FIGURE 2.
Expression of phosphorylated Akt in primary myoblasts isolated from Znt7 KO and control mice. A, expression of pAkt. Myoblasts of both genotypes were grown in collagen-coated 6-well plates for 48 h. After incubation of cells in supplement-free medium for 3 h, cells were stimulated by 100 nm insulin at 37 °C for 7 min. Cells were then harvested for Western blot analysis. A, representative Western blot is displayed. B, densitometry analysis of the Western blot protein bands. The densities of the protein bands of pAkt and Actb were determined by Image Lab 2.0.1 software (Bio-Rad). The expression of pAkt was then normalized by the expression of Actb. Percentage of expression was calculated as the ratio of the normalized value of each sample to that of the corresponding mock-treated control myoblast sample. Three independent primary myoblast preparations from either Znt7 KO or control skeletal muscles were used in the experiments. Data are reported as mean ± S.E. (error bars) of two independent experiments (n = 6–8). *, p < 0.05.
FIGURE 3.
FIGURE 3.
mRNA expression of insulin-responsive genes in Znt7 KO and control myotubes. Myoblasts of both genotypes were allowed to differentiate for 6 days before harvest for total RNA isolation or for insulin treatment before RNA isolation. The amount of the target mRNA was measured by a SYBR-based quantitative RT-PCR and analyzed using REST 2009 software (45). Actb and β2m were used as the internal references, and two independent experiments, each with three independent primary myotube lines (both genotypes), were performed. Data were plotted as whisker boxes representing the relative transcription levels of Insr, Irs1, Irs2, Akt1, and Glut4. The horizontal dotted lines in the boxes represent the median values, and the boxes represent the middle 50% of the observations. The top and bottom whiskers (vertical lines) represent the upper 25% and lower 25% of observations, respectively. A, myotubes of both genotypes were harvested for total RNA isolation and quantitative RT-PCR analysis after a 6-day differentiation. The expression of Insr, Irs1, Irs2, Akt1, and Glut4 in Znt7 KO myotubes was compared with their transcription in the wild type control. **, p < 0.01. B, after differentiation, myotubes of both genotypes were preincubated with supplement-free medium for 3 h followed by either 0 or 100 nm insulin treatment (7 min) before harvest. The expression of Insr, Irs1, Irs2, Akt1, and Glut4 in the indicated samples was compared with their transcription in the 0 nm insulin-treated controls. *, p < 0.05.
FIGURE 4.
FIGURE 4.
Analysis of L6 cells expressing ZnT7-Myc protein. A, subcellular localization of endogenous ZnT7 or exogenous ZnT7-Myc protein in L6 myoblasts. Cells were grown in the complete α-MEM for 48 h before staining. ZnT7 was detected by the ZnT7 antibody (20), and ZnT7-Myc was detected by the Myc antibody. B, mRNA expression of insulin-responsive genes in ZnT7-Myc-expressing or vector control L6 myotubes. ZnT7-Myc-expressing and vector control L6 myoblasts were allowed to differentiate for 6 days to myotubes. Myotubes were then preincubated in supplement-free DMEM at 37 °C for 3 h and treated with 0, 10, or 100 nm insulin at 37 °C for 7 min before harvest. The amount of the target mRNA was measured by a SYBR-based quantitative RT-PCR and analyzed using REST 2009 software (45). Actb and β2m were used as the internal references. The data were obtained from three individual L6 stable cell lines for either ZnT7-Myc-expression or vector control. The experiments were performed twice in duplicate. The data were plotted as whisker boxes representing the relative transcription levels of Insr, Irs1, Irs2, Akt1, and Glut4. The horizontal dotted lines in the boxes represent the median values, and the boxes represent the middle 50% of the observations. The top and bottom whiskers (vertical lines) represent the upper 25% and lower 25% of observations, respectively. The expression of Insr, Irs1, Irs2, Akt1, and Glut4 in the indicated samples was compared with the expression of the genes in 0 nm insulin-treated L6 vector control cells. C, expression of phosphorylated Irs2. D, expression of phosphorylated Akt. ZnT7-Myc-expressing myotubes and vector control were preincubated with supplement-free medium for 3 h followed by either 0 or 10 nm insulin treatment (7 min) before harvest. The densities of the protein bands of pIrs2, pAkt, and Actb were determined by Image Lab 2.0.1 software (Bio-Rad). The expression of pIrs2 and pAkt was normalized to the expression of Actb. Three individual L6/ZnT7-Myc and three individual control myotube lines were used in the experiments. Data are reported as mean ± S.E. (error bars) of three independent experiments (n = 9–10). *, p < 0.05; **, p < 0.01.
FIGURE 5.
FIGURE 5.
[14C]2-DG uptake in L6/ZnT7-Myc and control myotubes. L6/ZnT7-Myc and control myoblasts were allowed to differentiate to myotubes and preincubated with medium containing 0.2% FBS for 16 h before the uptake assay. Cells were then serum-starved in α-MEM containing 75 μm ZnSO4 for 4 h, followed by a 60-min incubation in KRH buffer containing 75 μm ZnSO4. Insulin (0, 10, or 100 nm) was added for 15 min, followed by 10 μm [14C]2-DG plus 100 μm unlabeled glucose for 15 min. The [14C]2-DG uptake was expressed per min per mg of lysate protein. Two individual cell lines of L6/ZnT7-Myc and two individual control cell lines were used in the uptake experiments. Data are reported as mean ± S.E. (error bars) of three independent experiments in triplicate (n = 16–18). *, p < 0.05 versus control basal; **, p < 0.01 versus control basal; #, p < 0.05 versus L6/ZnT7 basal; ##, p < 0.01 versus L6/ZnT7 basal; a, p < 0.05 versus control treated with 10 nm insulin; b, p < 0.05 versus control treated with 100 nm insulin.
FIGURE 6.
FIGURE 6.
Growth curves and body weight gains of Znt7 KO and control mice fed either the low or high fat diet. A, male; B, female. Mice were fed either a low or a high fat diet at 5 weeks of age for 12 weeks, and body weights were measured at the indicated time points after mice were fed the special diet. All values are expressed as mean ± S.E. (error bars), n = 9–13/group. The insets are summaries of the total body weight gains of male and female Znt7 KO and control mice after 12-week feeding of the indicated diet. Values are mean ± S.E., n = 9–13/group. *, p < 0.05. BW, body weight; WT, C57Bl/6 mice; KO, Znt7 knock-out mice.
FIGURE 7.
FIGURE 7.
Fat pad weights and body compositions of Znt7 KO and control mice. Mice were fed either the low or high fat diet at 5 weeks of age for 12 weeks. Mice were fasted for 16–18 h. Fat pad weights of male (A) and female (B) are displayed as wet weights (mg). Body compositions are expressed as weight (g) for male (C) and female (D) and as percentage for male (E) and female (F). Values are mean ± S.E. (error bars), n = 9–13/group. *, p < 0.05. WT, C57Bl/6 mice; Epi, epididymal fat; Retro, retroperitoneal fat; Mesen, mesenteric fat.
FIGURE 8.
FIGURE 8.
Blood glucose and serum insulin levels in Znt7 KO and control mice during oral glucose tolerance tests. Mice were fed either the low or high fat diet at 5 weeks of age for 10 weeks and fasted for 16–18 h before the test. Blood was collected at the indicated time points after the oral glucose load. A and B, blood glucose levels in male and female mice, respectively, during the oral glucose tolerance test. C, area under the curve for glucose (AUC glucose). D, serum insulin levels in male Znt7 KO and control mice during the oral glucose tolerance test. Values are the mean ± S.E. (error bars), n = 11–14/group. E, area under the curve for insulin (AUC insulin). Values are the mean ± S.E., n = 7–11/group. *, p < 0.05; **, p < 0.01; #, p = 0.05.
FIGURE 9.
FIGURE 9.
Blood glucose levels in Znt7 KO and control mice during insulin tolerance tests. Mice were fed the high fat diet at 5 weeks of age for 10 weeks and fasted for 4 h before the test. Blood was collected at the indicated time points after insulin injection. A, male; B, female. C, area under the curve for glucose (AUC glucose). Values are the mean ± S.E. (error bars), n = 8–11/group. *, p < 0.05.

Similar articles

Cited by

References

    1. Palmiter R. D., Huang L. (2004) Efflux and compartmentalization of zinc by members of the SLC30 family of solute carriers. Pflugers Arch. 447, 744–751 - PubMed
    1. Kambe T., Narita H., Yamaguchi-Iwai Y., Hirose J., Amano T., Sugiura N., Sasaki R., Mori K., Iwanaga T., Nagao M. (2002) Cloning and characterization of a novel mammalian zinc transporter, zinc transporter 5, abundantly expressed in pancreatic beta cells. J. Biol. Chem. 277, 19049–19055 - PubMed
    1. Jackson K. A., Helston R. M., McKay J. A., O'Neill E. D., Mathers J. C., Ford D. (2007) Splice variants of the human zinc transporter ZnT5 (SLC30A5) are differentially localized and regulated by zinc through transcription and mRNA stability. J. Biol. Chem. 282, 10423–10431 - PubMed
    1. Eide D.J. (2004) The SLC39 family of metal ion transporters. Pflugers Arch. 447, 796–800 - PubMed
    1. Valentine R. A., Jackson K. A., Christie G. R., Mathers J. C., Taylor P. M., Ford D. (2007) ZnT5 variant B is a bidirectional zinc transporter and mediates zinc uptake in human intestinal Caco-2 cells. J. Biol. Chem. 282, 14389–14393 - PubMed

Publication types

MeSH terms