. 2012 Sep 21;287(39):32717-27.
doi: 10.1074/jbc.M112.373472. Epub 2012 Aug 1.

Distinctive features of catalytic and transport mechanisms in mammalian sarco-endoplasmic reticulum Ca2+ ATPase (SERCA) and Cu+ (ATP7A/B) ATPases

Affiliations

Distinctive features of catalytic and transport mechanisms in mammalian sarco-endoplasmic reticulum Ca2+ ATPase (SERCA) and Cu+ (ATP7A/B) ATPases

David Lewis et al. J Biol Chem. .

Abstract

Ca(2+) (sarco-endoplasmic reticulum Ca(2+) ATPase (SERCA)) and Cu(+) (ATP7A/B) ATPases utilize ATP through formation of a phosphoenzyme intermediate (E-P) whereby phosphorylation potential affects affinity and orientation of bound cation. SERCA E-P formation is rate-limited by enzyme activation by Ca(2+), demonstrated by the addition of ATP and Ca(2+) to SERCA deprived of Ca(2+) (E2) as compared with ATP to Ca(2+)-activated enzyme (E1·2Ca(2+)). Activation by Ca(2+) is slower at low pH (2H(+)·E2 to E1·2Ca(2+)) and little sensitive to temperature-dependent activation energy. On the other hand, subsequent (forward or reverse) phosphoenzyme processing is sensitive to activation energy, which relieves conformational constraints limiting Ca(2+) translocation. A "H(+)-gated pathway," demonstrated by experiments on pH variations, charge transfer, and Glu-309 mutation allows luminal Ca(2+) release by H(+)/Ca(2+) exchange. As compared with SERCA, initial utilization of ATP by ATP7A/B is much slower and highly sensitive to temperature-dependent activation energy, suggesting conformational constraints of the headpiece domains. Contrary to SERCA, ATP7B phosphoenzyme cleavage shows much lower temperature dependence than EP formation. ATP-dependent charge transfer in ATP7A and -B is observed, with no variation of net charge upon pH changes and no evidence of Cu(+)/H(+) exchange. As opposed to SERCA after Ca(2+) chelation, ATP7A/B does not undergo reverse phosphorylation with P(i) after copper chelation unless a large N-metal binding extension segment is deleted. This is attributed to the inactivating interaction of the copper-deprived N-metal binding extension with the headpiece domains. We conclude that in addition to common (P-type) phosphoenzyme intermediate formation, SERCA and ATP7A/B possess distinctive features of catalytic and transport mechanisms.


Figures

SCHEME 1.
SCHEME 1.
FIGURE 1.
FIGURE 1.
Two-dimensional folding models of the SERCA (upper panel) and ATP7B (lower panel) sequences. The diagrams show 10 (SERCA) or 8 (ATP7B) transmembrane segments including the calcium or copper binding sites (TMBS) involved in enzyme activation and transport. The extramembranous region of both enzymes comprises a nucleotide binding domain (N), the P domain, with several residues (in yellow) conserved in P-type ATPases, including the aspartate (Asp-351 or Asp-1027) that undergoes phosphorylation to form the catalytic phosphoenzyme intermediate (EP), and the A domain with the TGE conserved sequence involved in catalytic assistance of EP hydrolytic cleavage. The His-1069 residue whose mutation is frequently found in Wilson disease is shown on the N domain of ATP7B. Specific features of ATP7B are the N-metal binding domain (NMBD) extension with six putative copper binding sites and serine residues undergoing kinase-assisted phosphorylation (Ser-478, Ser-481, Ser-1211, Ser-1453).
FIGURE 2.
FIGURE 2.
Steady state Ca2+ ATPase activity of native Ca2+ ATPase. ATP hydrolysis was measured at pH 6.0 or 7.5 in the presence of a Ca2+ ionophore (A23187) to prevent Ca2+ accumulation in SR vesicles and ATPase “back inhibition.” The reaction mixture contained 50 mm MES (pH 6.0) or HEPES (pH 7.5), 80 mm KCl (when indicated), 3 mm MgCl2, 20 μm CaCl2, 30 μg of SR protein/ml, and 1 μm A23187. A low rate of Ca2+-independent ATPase activity, measured in the presence of EGTA and no added Ca2+, was subtracted from the total. The reaction was started by the addition of 2.5 mm ATP at 10 or 30 °C temperature, and samples were collected at time intervals. ATPase velocity was calculated from linear slopes of Pi production.
FIGURE 3.
FIGURE 3.
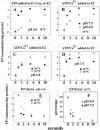
Time course of phosphoenzyme intermediate formation (A, B, C, and D) after the addition of ATP to Ca2+ ATPase and subsequent phosphoenzyme decay (E and F). Phosphorylation was obtained by the addition of 50 μm [γ-32P]ATP to ATPase preincubated with Ca2+ (● in A) or the addition of 50 μm [γ-32P]ATP and Ca2+ to ATPase deprived of Ca2+ (○ in A and all variables in B–D) at 10 or 30 °C as indicated. The reaction mixture contained 50 mm HEPES (pH 7.5) or 50 mm MES (pH 6.0), 80 mm KCl, and 3 mm MgCl2. The CaCl2 concentration was 20 μm in A. Alternatively, the reaction mixture contained 1 mm (at pH 7.5) or 5 mm EGTA (at pH 6.0) before the addition of ATP and then either 1 mm (at pH 7.5) or 5 mm (at pH 6.0) CaCl2 was added with the [γ-32P]ATP. The reaction was quenched at serial times with 5% trichloroacetic acid, and the quenched samples were filtered through 0.45-μm Millipore nitrocellulose filters that were then washed 3 times with cold 0.125 m perchloric acid and once with water and processed for determination of radioactivity by scintillation counting. Decay of phosphoenzyme intermediate (E and F) was obtained by first incubating ATPase with [γ-32P]ATP for 10 s at pH 6 and 10 °C temperature followed by a 4-fold dilution with an identical medium but containing 1 mm nonradioactive ATP. Temperature and pH are as indicated in the figure. Quenching and collection of serial samples are as described above. The experimental points are averages of values obtained in three to four different experiments.
FIGURE 4.
FIGURE 4.
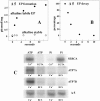
Phosphoprotein formation after the addition of ATP to recombinant SERCA (A) or ATP7B (B–D) and subsequent decay of ATP7B phosphoenzyme (E and F). Microsomes obtained from COS-1 cells sustaining heterologous expression were incubated with 50 μm [γ-32P]ATP at 10 or 30 °C at various pH levels as explained under “Experimental Procedures.” Electrophoresis in acid buffer or alkaline buffer was then performed to distinguish total [32P]phosphoprotein (■) from alkali-resistant [32P]phosphoprotein (serine and/or threonine, □). The difference is considered alkali-labile [32P]phosphoprotein (aspartate, ●) and attributed to formation of phosphorylated enzyme intermediate. acid and alkaline refer to the media used for resuspension of samples and electrophoresis. Electrophoretic gel images correspond to sequential samples obtained within the time scale shown in the horizontal axis. Note that no alkaline-resistant phosphoprotein was obtained with SERCA, whereas both alkaline-resistant and alkaline-labile phosphorylation were obtained with ATP7B. Only the difference (phosphorylated enzyme intermediate) is shown in the lower panels (C–F). Decay of phosphoenzyme was measured as explained under “Experimental Procedures” and in the legend to Fig. 3. The experimental points are averages of values obtained in three to four different experiments. The electrophoretic images in A and B are examples of data repeated in all experiments.
FIGURE 5.
FIGURE 5.
Charge measurements on native SR Ca2+ ATPase (SERCA) and recombinant Cu+ ATPase (ATP7A and ATP7B). A, current transients were obtained after 100 μm ATP concentration jumps on SERCA in the presence of 10 μm free Ca2+ and 100 mm KCl at pH 7 (solid line) and 7.8 (dotted line). B, current transients were obtained after 100 μm ATP concentration jumps on SERCA in the presence of 10 μm free Ca2+ and 100 mm choline chloride (Chol.Cl) at pH 7 (solid line) and 7.8 (dotted line). C, shown are current transients obtained after 100 μm ATP concentration jumps on ATP7B in the presence of 5 μm CuCl2 and 300 mm KCl at pH 6 (solid line) and 7.8 (dotted line). D, shown is dependence of the normalized charge after 100 μm ATP concentration jumps on pH in the case of ATP7A (▵), ATP7B (▴), and SERCA (100 mm KCl, ●; and 100 mm choline chloride, ○). For each protein, the charges are normalized with respect to the value measured at pH 7. S.E. are given by error bars in the lower right panel.
FIGURE 6.
FIGURE 6.
Time course of EP formation through utilization of [32P]Pi by WT SERCA (A) and E309Q mutant (B) and decay (C and D) of [32P]phosphoenzyme after a chase with nonradioactive Pi. Microsomes derived from COS1 cells expressing SERCA or E309Q mutant were incubated with 50 mm MES, pH 6.0, 20% Me2SO4, 10 mm MgCl2, and 2 mm EGTA. The reaction was started by the addition of 50 μm [32P]Pi, quenched at different times, and processed for determination of radioactive protein by electrophoretic analysis and detection of radioactivity (see “Experimental Procedures”). For determination of decay, the protein was incubated with 50 μm [32P]Pi as described above at 10 °C for 2 min, and then a 20-fold dilution was obtained with a medium containing 50 mm MES, pH 6.0, 10 mm MgCl2, 2 mm EGTA, and 1 mm nonradioactive Pi at 10 or 30 °C. Serial samples were taken at sequential times for acid quenching and determination of residual radioactive protein by electrophoretic analysis and detection of radioactivity. The experimental points are averages of values obtained in three to four different experiments.
FIGURE 7.
FIGURE 7.
Equilibrium levels of phosphoenzyme obtained through utilization of [32P]Pi by recombinant SERCA and E309Q mutant at acid or alkaline pH. Effects of K+ and Ca2+ are shown. Microsomes derived from COS1 cells expressing SERCA or mutant (E309Q) protein were diluted (50 μg/ml) in medium containing 50 mm MES (pH 6.0) or HEPES (pH 7.5), 20% Me2SO4, and 10 mm MgCl2. 2 mm EGTA, 100 mm KCl, and 1 mm CaCl2 (in the absence of EGTA) were added as indicated in the figure. The reaction was started by the addition of 50 μm [32P]P, at 30 °C temperature and acid-quenched after 2 min. The quenched samples were processed for determination of radioactive protein by electrophoretic analysis and detection of radioactivity.
FIGURE 8.
FIGURE 8.
Functional behavior of Δ5 ATP7B (large NMBD segment deleted). A and B, formation of [γ-32P]phosphoenzyme after [γ-32P]ATP utilization by Δ5 ATP7B and decay of [γ-32P]phosphoenzyme after a chase with excess nonradioactive ATP. The experiments were performed at pH 6.0 and 10 °C temperature as described in the legend to Fig. 4. The low phosphoenzyme levels are due to low concentration of expressed protein in the microsomes of the infected COS-1 cells. C, electrophoretic demonstration of phosphoenzyme formation through utilization of [γ-32P]ATP or [32P]Pi by SERCA, ATP7A, ATP7B, and Δ5 ATP7B is shown. Microsomes derived from COS1 cells expressing SERCA were incubated with 50 μm [γ-32P]ATP for 5 s at 30 °C in a reaction mixture containing 50 mm MES (pH 6.0), 3 mm MgCl2, 100 mm KCl, and 10 μm CaCl2 or 2 mm EGTA as indicated. Microsomes derived from COS1 cells expressing ATP7A, ATP7B, or Δ5 ATP7B mutant protein were incubated with 50 μm [γ-32P]ATP for 5 s at 30 °C in a reaction mixture containing 50 mm MES, pH 6.0, 300 mm KCl, 10 mm DTT, 3 mm MgCl2, and 5 μm CuCl2 or 2 mm BCS as indicated. Alternatively, microsomes derived from COS1 cells expressing SERCA were incubated with 50 μm [32P]Pi for 2 min at 30 °C in a reaction mixture containing 50 mm MES, pH 6.0, 10 mm MgCl2, 20% Me2SO4, and 1 mm CaCl2 or 2 mm EGTA as indicated. Microsomes derived from COS1 cells expressing ATP7A, ATP7B, or Δ5 ATP7B mutant protein were incubated with 50 μm [γ-32P]Pi for 2 min at 30 °C in a reaction mixture containing 50 mm MES (pH 6.0), 10 mm DTT, 10 mm MgCl2, 20% Me2SO4, and 5 μm CuCl2 or 2 mm BCS as indicated. The reactions were acid-quenched, and the samples were processed for determination of radioactive protein by electrophoretic analysis and detection of radioactivity. It is noteworthy that no kinase-mediated Ser/Thr phosphorylation was noted when Pi rather than ATP was used as a substrate.
FIGURE 9.
FIGURE 9.
Diagram of the SERCA Ca2+ binding sites in the E1·2Ca2+ and in the E2 state stabilized by thapsigargin (TG) and dibutyldihydroxybenzene (BHQ) (44) based on crystallography (12, 42) and continuum of electrostatic calculations. The larger cyan spheres in the upper diagram represent bound Ca2+ (I and II), and the small red spheres represent water. Small red circles represent bound protons, dotted pink lines represent hydrogen bonds, and green dotted lines represent Ca2+ coordination. The arrows indicate possible movements upon state transition. Data are derived from Obara et al. (44).

Similar articles

Cited by

References

    1. Albers R. W. (1967) Biochemical aspects of active transport. Annu. Rev. Biochem. 36, 727–756 - PubMed
    1. de Meis L., Vianna A. L. (1979) Energy interconversion by the Ca2+-dependent ATPase of the sarcoplasmic reticulum. Annu. Rev. Biochem. 48, 275–292 - PubMed
    1. Post R. L., Hegyvary C., Kume S. (1972) Activation by adenosine triphosphate in the phosphorylation kinetics of sodium and potassium ion transport adenosine triphosphatase. J. Biol. Chem. 247, 6530–6540 - PubMed
    1. Brini M., Carafoli E. (2009) Calcium pumps in health and disease. Physiol. Rev. 89, 1341–1378 - PubMed
    1. MacLennan D. H., Brandl C. J., Korczak B., Green N. M. (1985) Amino-acid sequence of a Ca2+ + Mg2+-dependent ATPase from rabbit muscle sarcoplasmic reticulum, deduced from its complementary DNA sequence. Nature 316, 696–700 - PubMed

Publication types

MeSH terms

Substances