

Hepatitis C virus envelope glycoprotein fitness defines virus population composition following transmission to a new host
- PMID: 22855498
- PMCID: PMC3486514
- DOI: 10.1128/JVI.01079-12
Hepatitis C virus envelope glycoprotein fitness defines virus population composition following transmission to a new host
Abstract
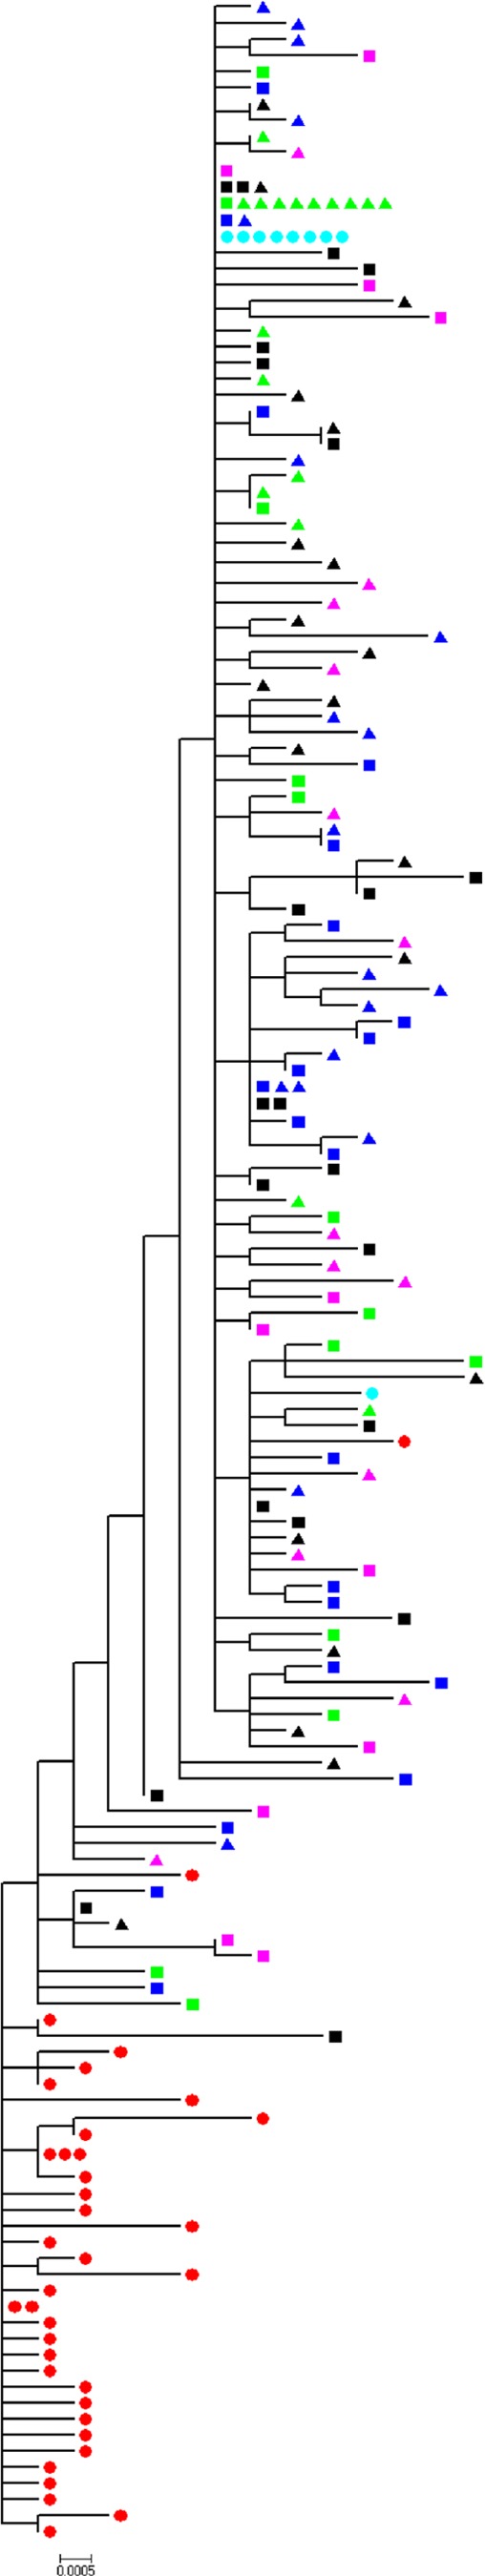
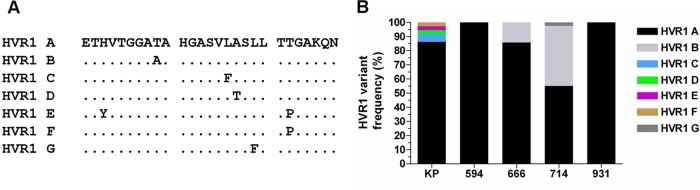
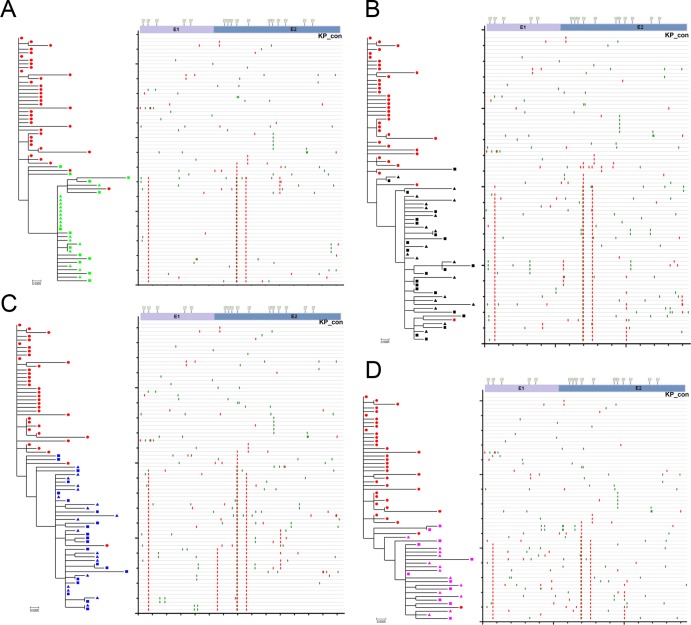
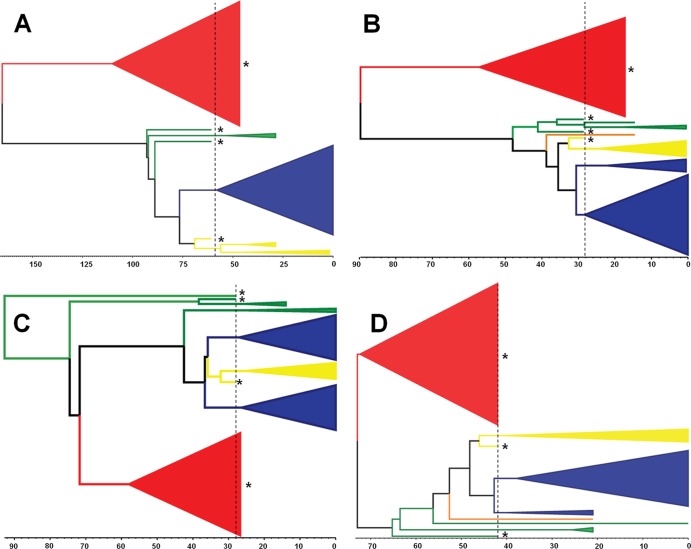
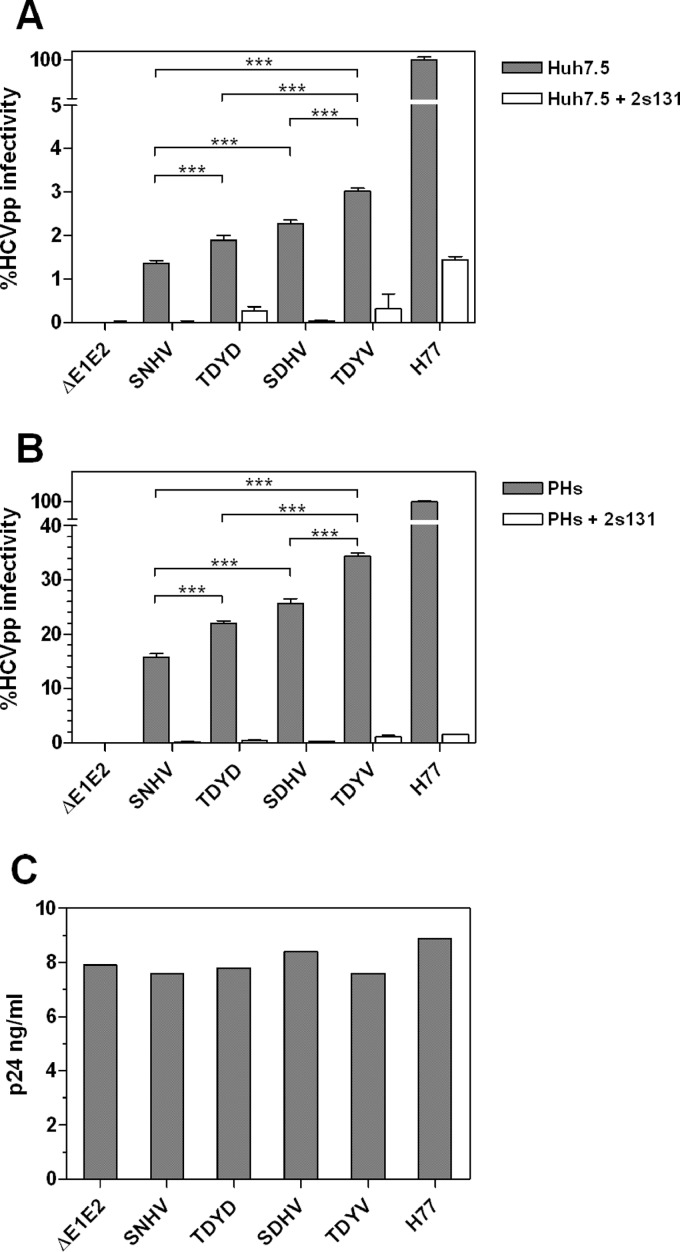
Genetic variability is a hallmark of RNA virus populations. However, transmission to a new host often results in a marked decrease in population diversity. This genetic bottlenecking is observed during hepatitis C virus (HCV) transmission and can arise via a selective sweep or through the founder effect. To model HCV transmission, we utilized chimeric SCID/Alb-uPA mice with transplanted human hepatocytes and infected them with a human serum HCV inoculum. E1E2 glycoprotein gene sequences in the donor inoculum and recipient mice were determined following single-genome amplification (SGA). In independent experiments, using mice with liver cells grafted from different sources, an E1E2 variant undetectable in the source inoculum was selected for during transmission. Bayesian coalescent analyses indicated that this variant arose in the inoculum pretransmission. Transmitted variants that established initial infection harbored key substitutions in E1E2 outside HVR1. Notably, all posttransmission E1E2s had lost a potential N-linked glycosylation site (PNGS) in E2. In lentiviral pseudoparticle assays, the major posttransmission E1E2 variant conferred an increased capacity for entry compared to the major variant present in the inoculum. Together, these data demonstrate that increased envelope glycoprotein fitness can drive selective outgrowth of minor variants posttransmission and that loss of a PNGS is integral to this improved phenotype. Mathematical modeling of the dynamics of competing HCV variants indicated that relatively modest differences in glycoprotein fitness can result in marked shifts in virus population composition. Overall, these data provide important insights into the dynamics and selection of HCV populations during transmission.
Figures
Similar articles
-
Sequence and functional analysis of the envelope glycoproteins of hepatitis C virus variants selectively transmitted to a new host.J Virol. 2013 Dec;87(24):13609-18. doi: 10.1128/JVI.02119-13. Epub 2013 Oct 9. J Virol. 2013. PMID: 24109215 Free PMC article.
-
Specialization of Hepatitis C Virus Envelope Glycoproteins for B Lymphocytes in Chronically Infected Patients.J Virol. 2015 Nov 4;90(2):992-1008. doi: 10.1128/JVI.02516-15. Print 2016 Jan 15. J Virol. 2015. PMID: 26537674 Free PMC article.
-
Fine mapping of murine antibody responses to immunization with a novel soluble form of hepatitis C virus envelope glycoprotein complex.J Virol. 2014 Sep;88(18):10459-71. doi: 10.1128/JVI.01584-14. Epub 2014 Jun 25. J Virol. 2014. PMID: 24965471 Free PMC article.
-
Computational Modeling of Hepatitis C Virus Envelope Glycoprotein Structure and Recognition.Front Immunol. 2018 May 28;9:1117. doi: 10.3389/fimmu.2018.01117. eCollection 2018. Front Immunol. 2018. PMID: 29892287 Free PMC article. Review.
-
Glycan Shielding and Modulation of Hepatitis C Virus Neutralizing Antibodies.Front Immunol. 2018 Apr 27;9:910. doi: 10.3389/fimmu.2018.00910. eCollection 2018. Front Immunol. 2018. PMID: 29755477 Free PMC article. Review.
Cited by
-
A Diverse Panel of Hepatitis C Virus Glycoproteins for Use in Vaccine Research Reveals Extremes of Monoclonal Antibody Neutralization Resistance.J Virol. 2015 Dec 23;90(7):3288-301. doi: 10.1128/JVI.02700-15. J Virol. 2015. PMID: 26699643 Free PMC article.
-
Genomic characterization of hepatitis C virus transmitted founder variants with deep sequencing.Infect Genet Evol. 2019 Jul;71:36-41. doi: 10.1016/j.meegid.2019.02.032. Epub 2019 Mar 8. Infect Genet Evol. 2019. PMID: 30853512 Free PMC article.
-
Immune mechanisms of vaccine induced protection against chronic hepatitis C virus infection in chimpanzees.World J Hepatol. 2015 Jan 27;7(1):53-69. doi: 10.4254/wjh.v7.i1.53. World J Hepatol. 2015. PMID: 25624997 Free PMC article. Review.
-
New generation humanized mice for virus research: comparative aspects and future prospects.Virology. 2013 Jan 5;435(1):14-28. doi: 10.1016/j.virol.2012.10.007. Virology. 2013. PMID: 23217612 Free PMC article. Review.
-
Generation of improved humanized mouse models for human infectious diseases.J Immunol Methods. 2014 Aug;410:3-17. doi: 10.1016/j.jim.2014.02.011. Epub 2014 Mar 4. J Immunol Methods. 2014. PMID: 24607601 Free PMC article. Review.
References
-
- Alter MJ. 2002. Prevention of spread of hepatitis C. Hepatology 36:S93–98 - PubMed
-
- Anderson JA, et al. 2010. HIV-1 populations in semen arise through multiple mechanisms. PLoS Pathog. 6:e1001053 doi:10.1371/journal.ppat.1001053 - DOI - PMC - PubMed
-
- Brown RJP, et al. 2007. Cross-genotype characterization of genetic diversity and molecular adaptation in hepatitis C virus envelope glycoprotein genes. J. Gen. Virol. 88:458–469 - PubMed
Publication types
MeSH terms
Substances
Grants and funding
LinkOut - more resources
Full Text Sources
Medical
Miscellaneous
