. 2012 Oct;40(19):9691-704.
doi: 10.1093/nar/gks671. Epub 2012 Aug 1.

Cell type-specific genomics of Drosophila neurons

Affiliations

Cell type-specific genomics of Drosophila neurons

Gilbert L Henry et al. Nucleic Acids Res. 2012 Oct.

Abstract

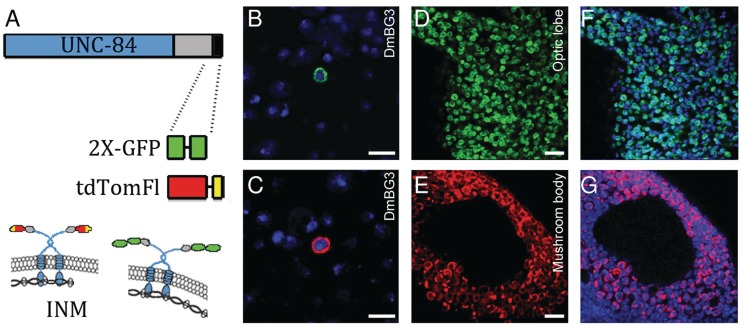
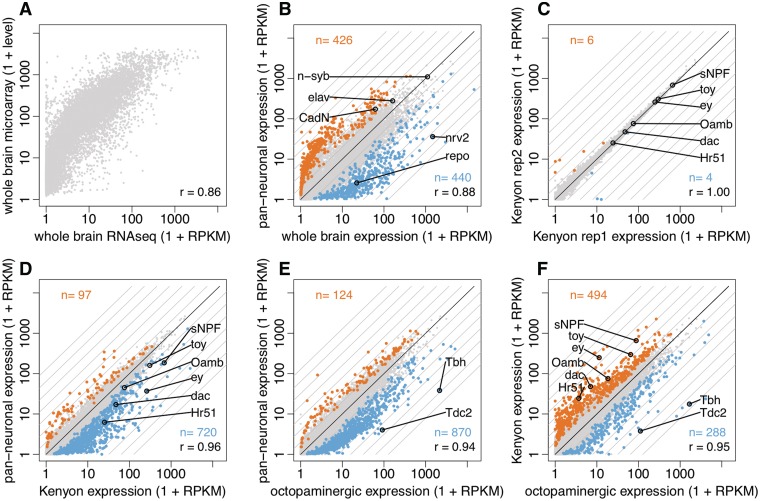
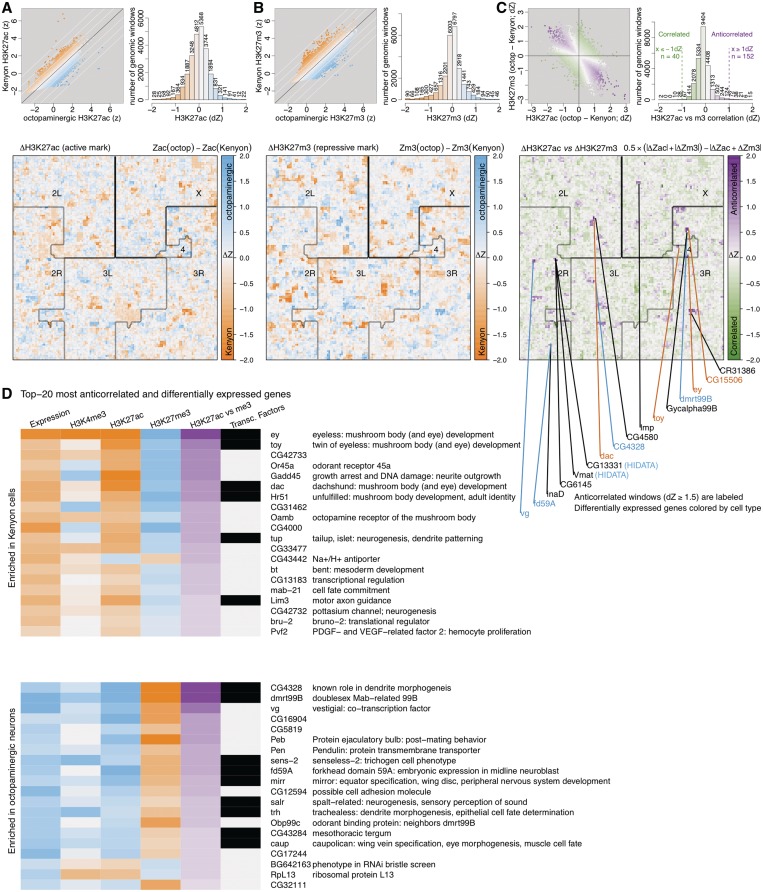
Many tools are available to analyse genomes but are often challenging to use in a cell type-specific context. We have developed a method similar to the isolation of nuclei tagged in a specific cell type (INTACT) technique [Deal,R.B. and Henikoff,S. (2010) A simple method for gene expression and chromatin profiling of individual cell types within a tissue. Dev. Cell, 18, 1030-1040; Steiner,F.A., Talbert,P.B., Kasinathan,S., Deal,R.B. and Henikoff,S. (2012) Cell-type-specific nuclei purification from whole animals for genome-wide expression and chromatin profiling. Genome Res., doi:10.1101/gr.131748.111], first developed in plants, for use in Drosophila neurons. We profile gene expression and histone modifications in Kenyon cells and octopaminergic neurons in the adult brain. In addition to recovering known gene expression differences, we also observe significant cell type-specific chromatin modifications. In particular, a small subset of differentially expressed genes exhibits a striking anti-correlation between repressive and activating histone modifications. These genes are enriched for transcription factors, recovering those known to regulate mushroom body identity and predicting analogous regulators of octopaminergic neurons. Our results suggest that applying INTACT to specific neuronal populations can illuminate the transcriptional regulatory networks that underlie neuronal cell identity.


Figures

Figure 1.
Figure 1.
Construction and localization of an UNC-84 based nuclear tag. (A) Either two copies of GFP (2XGFP) or Flag-tagged tdTomato (tdTomFl) were placed at the C-terminus of UNC-84. The gray box denotes the conserved SUN domain and the black box the area in the protein where the tag is inserted. At the bottom of (A) the topological distribution of the fusion proteins, in the inner nuclear membrane, are indicated (30). ML-DmBG3-c2 cells expressing either a GFP (B) or tdTomato based tag (C). Localization of the two tags in adult Drosophila brains (D–G). Expression of either the green (D, F) or red (E, G) tag was driven by the pan-neuronal driver R57C10-Gal4 (12). In (D, F) the medial edge of the optic lobe is shown, whereas the Kenyon cell population of the mushroom body is shown in (E, G). Nuclei are labeled by Draq5 and indicated in blue (B, C, F and G). Scale bars: 10 μm.
Figure 2.
Figure 2.
The purification of tagged nuclei. (A–F) Separate populations of green and red tagged ML-DmBg3-c2 cells were prepared by transfection. The cells were mixed, nuclei harvested and the sample split into two identical inputs (A, D). α-GFP adsorbed beads (B) were used to capture nuclei in one sample, and α-Flag beads were used in the other (E). The unbound nuclei that fail to be captured in either the α-GFP or α-Flag binding reactions are shown in (C) and (F) respectively. As indicated in the wash samples the capture of GFP tagged nuclei is typically more efficient (compare C with F). For in vivo binding studies, tag expression was driven by R57C10-GAL4 (G), OK107-GAL4 (H) and Tdc2-GAL4 drivers (I) (12,31,32). Schematic of the INTACT procedure using in vivo tagged nuclei (J). In the diagram, tagged nuclei are indicated by the green and red patches inside of the heads of the two flies. The method involves two steps: first, nuclei are obtained from tagged flies; second, magnetic beads are used to purify tagged nuclei. The gray ellipse denotes the magnetic bead and either the green or red ‘T’ the particular antibody used for capture (J). Nuclei were stained with Draq5 and are indicated in blue (G-I). Scale bars: 40 μm.
Figure 3.
Figure 3.
Gene expression profiles of neuronal subpopulations. (A) Gene expression levels estimated from RNA-seq of dissected whole brain correlate well with microarray levels. (B) Pan-neuronal nuclear RNA is enriched for known markers of neurons (n-syb, elav, CadN) and significantly depleted for glial markers (repo, nrv2). Differentially expressed genes (q < 0.01) are shown in color. (C) Gene expression levels estimated from biological replicates of INTACT isolated Kenyon cell nuclei are highly correlated. (D) Kenyon cell nuclei and (E) octopaminergic nuclei are both enriched for known markers relative to pan-neuronal nuclei. (F) Comparing the expression profiles of Kenyon cell vs. octopaminergic nuclei correctly recovers known markers.
Figure 4.
Figure 4.
Cell type–specific chromatin profiles of neuronal subpopulations. ChIP-seq profiling of active promoter [(A) H3K4me3], active chromatin [(B) H3K27me3] and silenced chromatin [(C) H3K27me3] obtained from INTACT isolated nuclei is strongly reproducible. (D–F) Comparing the chromatin profiles of Kenyon cells vs. octopaminergic cells correctly recovers known markers (orange, Kenyon cell; blue, octopaminergic neurons). (G–I) Differential histone modification is weakly, but significantly, correlated with differential gene expression. Genes with enriched expression in Kenyon cells are shown in orange, and those enriched in octopaminergic cells are shown in blue. In all panels, a point is shown only for the most highly expressed isoform of each annotated gene.
Figure 5.
Figure 5.
Cell type–specific chromatin silencing of transcription factors. (A) The main scatterplot depicts the level of repressive H3K27me3 histone modification over all annotated gene isoforms (grey points) as measured in octopaminergic (x-axis) and Kenyon cells (y-axis). The grey curve drawn above the scatterplot depicts the distribution of H3K27me3 marking over all genes in octopaminergic. The black curve represents the distribution for the subset of genes that are transcription factors. Similar curves drawn to the right of the plot reflect the H3K27me3 levels observed in Kenyon cells. A subset of transcription factors is strongly silenced (H3K27me3 z ≥ 2), as seen by the bimodal distribution (black line). Differentially expressed transcription factors are colored according to the population in which they are enriched (blue = octopaminergic, orange = Kenyon cells, point size indicates the magnitude of the difference in expression). This unbiased analysis reveals a handful of transcription factors that are enriched in one population, whereas repressed in the other (gray quadrants). These genes include Hr51, toy, dac and ey, all expressed in Kenyon cells and dmrt99b, Fer2, CG4328 and fd59A, which are expressed in octopaminergic neurons. (B) In Kenyon cells, ey is highly expressed from an active promoter, within an open chromatin domain that is not silenced. In contrast, this locus is not expressed, is not active (low H3K4me3, H3K27ac), and is strongly silenced (high H3K27me3) in octopaminergic neurons. (C) The dmrt99b locus exhibits the opposite pattern.
Figure 6.
Figure 6.
Genome-wide comparison of active versus silenced chromatin in octopaminergic and Kenyon cells. (A) Scatterplot: Each point represents the intensity of H3K27ac modification over a 10kb window (5kb increments) in the genome, as measured in octopaminergic (x-axis) and Kenyon cell (y-axis) populations. The points are colored to reflect the cell type with higher levels of modification (blue = octopaminergic cells; orange = Kenyon cells). The distribution of differential modification in each genomic window is shown in a histogram colored on the same scale, with each numeric label denoting the number of windows represented in each bar. The larger image represents the intensity of differential modification across all windows in the genome, colored on the same scale and organized into a Hilbert curve. A Hilbert curve is a self-similar, or fractal, curve that essentially folds a line representing the genome sequence onto itself and packs it into a two-dimensional image. Coloring this folded line according to a genomic signal, such as histone modification, offers a convenient way of visualizing genome-wide data (26). The curve begins at the top left corner of the image, with the first window of chromosome 2L, and winds counter-clockwise in an intricate pattern that ends in the top right corner with the last window of chromosome X. (B) A similar representation as (A) depicts the repressive H3K27me3 modification in the two cell populations. (C) A comparison of the levels of differential H3K27ac and H3K27me3 modification as measured in panels (A) and (B). The colors range from purple in windows with anti-correlated modifications (i.e. strong acetylation in one cell population and strong trimethylation in the other) to green in windows with strongly correlated modifications (more acetylation as well as trimethylation in the same population). The genes that fall under the most anti-correlated (dZ ≥ 1.5) loci are labeled below the Hilbert curve. The numbers of RNA-seq reads aligning to Vmat and the nested CG13331 gene in the octopaminergic population were so high that CUFFLINKS (20) was unable to reliably estimate expression levels and instead reported a ‘HIDATA’ signal. (D) Ranking the differentially expressed genes by the strength of this anti-correlation score enriches for transcription factors, including those known to regulate mushroom body development (ey, toy, dac, Hr51).

Similar articles

Cited by

References

    1. Davidson EH. The regulatory genome: gene regulatory networks in development and evolution. Amsterdam: Elsevier, Acad. Press; 2006.
    1. Hobert O. Regulation of terminal differentiation programs in the nervous system. Annual Ann. Review of Cell and Developmental. Biology Biol. 2011;27:681–696. - PubMed
    1. Roy S, Ernst J, Kharchenko PV, et al. Identification of functional elements and regulatory circuits by Drosophila modENCODE. Science. 2010;330:1787–1797. - PMC - PubMed
    1. Emmert-Buck MR, Bonner RF, Smith PD, et al. Laser capture microdissection. Science. 1996;274:998–1001. - PubMed
    1. Heiman M, Schaefer A, Gong S, et al. A translational profiling approach for the molecular characterization of CNS cell types. Cell. 2008;135:738–748. - PMC - PubMed

Publication types