. 2012 Sep 13;120(11):2280-9.
doi: 10.1182/blood-2012-03-419937. Epub 2012 Aug 1.

Genome-wide analysis reveals recurrent structural abnormalities of TP63 and other p53-related genes in peripheral T-cell lymphomas

Affiliations

Genome-wide analysis reveals recurrent structural abnormalities of TP63 and other p53-related genes in peripheral T-cell lymphomas

George Vasmatzis et al. Blood. .

Abstract

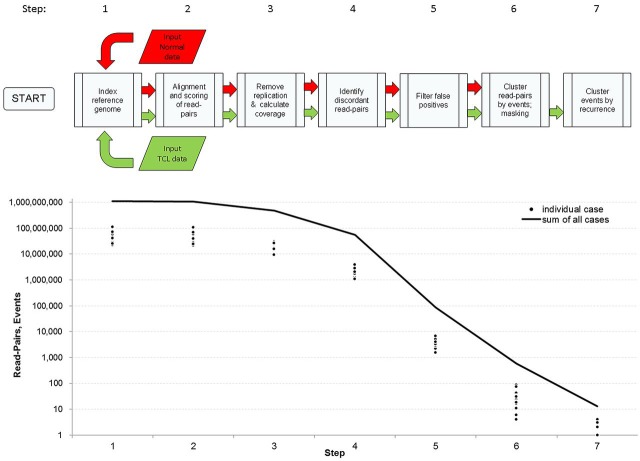
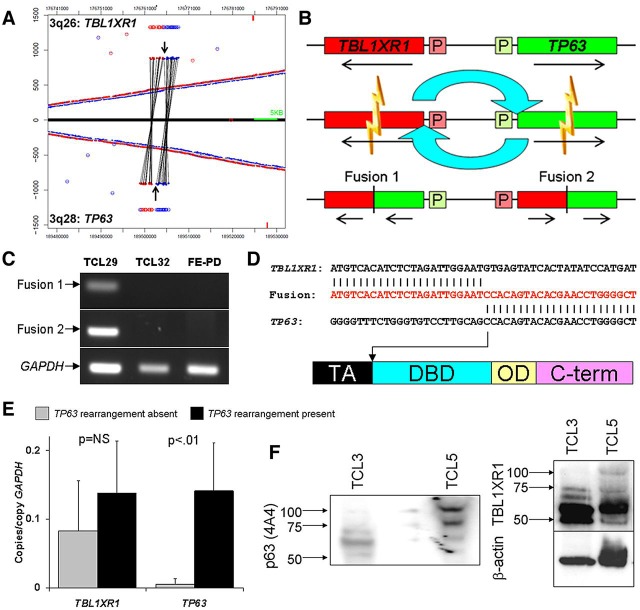
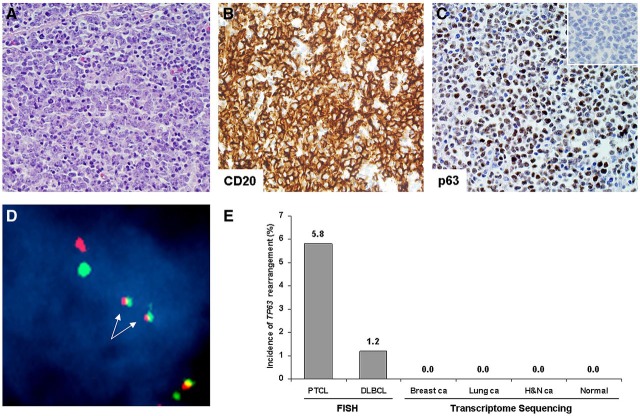
Peripheral T-cell lymphomas (PTCLs) are aggressive malignancies of mature T lymphocytes with 5-year overall survival rates of only ∼ 35%. Improvement in outcomes has been stymied by poor understanding of the genetics and molecular pathogenesis of PTCL, with a resulting paucity of molecular targets for therapy. We developed bioinformatic tools to identify chromosomal rearrangements using genome-wide, next-generation sequencing analysis of mate-pair DNA libraries and applied these tools to 16 PTCL patient tissue samples and 6 PTCL cell lines. Thirteen recurrent abnormalities were identified, of which 5 involved p53-related genes (TP53, TP63, CDKN2A, WWOX, and ANKRD11). Among these abnormalities were novel TP63 rearrangements encoding fusion proteins homologous to ΔNp63, a dominant-negative p63 isoform that inhibits the p53 pathway. TP63 rearrangements were seen in 11 (5.8%) of 190 PTCLs and were associated with inferior overall survival; they also were detected in 2 (1.2%) of 164 diffuse large B-cell lymphomas. As TP53 mutations are rare in PTCL compared with other malignancies, our findings suggest that a constellation of alternate genetic abnormalities may contribute to disruption of p53-associated tumor suppressor function in PTCL.


Figures

Figure 1
Figure 1
Approach to detect chromosomal rearrangements from mate-pair genomic DNA sequencing data. (Top) schematic of bioinformatic algorithm. False-positive calls were minimized using filters based on quality of mapping, quality of nearby sequence in the reference genome, and a mask developed from noncancerous samples (see “Mate-pair data mapping and bioinformatic analysis”). Candidate abnormalities were supported by at least 4 mate pairs with reads mapping > 15 kb apart. Events were classified as recurrent abnormalities when they shared breakpoints within 1 Mb in 2 or more cases. (Bottom) numbers of read pairs or rearrangement events after executing each step of the algorithm, shown for individual cases and as the sum of all cases.
Figure 2
Figure 2
Recurrent abnormalities in p53-related genes in peripheral T-cell lymphomas. (A) PCR using tumor-specific primers (supplemental Table 1) designed from aberrant mate-pair sequences from SR-786 indicating juxtaposition of POLR2A and WRAP53, situated on either side of TP53. (B) Partial results of Sanger sequencing (nucleotides in red) of the SR-786 amplicon from panel A spanning the POLR2A/WRAP53 breakpoints. (C) Count plot showing chr17p based on mate-pair data from TCL3, showing TP53 deletion. Each circle represents a 52-kb window (W, based on genomic coverage; see “Mate-pair data mapping and bioinformatic analysis”); the position along the y-axis represents the number of mate pairs mapping within each window. The horizontal red line represents the number of mate pairs expected for a copy-neutral locus based on normalization across the entire genome. The horizontal blue line represents the aberrant mate pairs, which map ∼ 174 kb apart (instead of the expected ∼ 5 kb based on the size selection used for mate-pair library preparation). (D) MLPA (see “Methods”) for ANKRD11 in cases without (TCL5, left) and with (TCL29, right) homozygous deletions. Numerals represent ratios of patient samples (blue peaks) to normal female controls (red peaks) for 2 probes (ANKR1 and ANKR12) to exon 1 of ANKRD11. The remaining gene probes are reference controls. (E) Metaphase CDKN2A/B FISH image from TCL29. Arrows point to centromeres of chromosomes 9 (CEP9; green signals). There is homozygous deletion of CDKN2A/B (absent red signals). For comparison, an interphase nucleus with 2 copies of the CDKN2A/B gene region is seen at bottom right (arrowhead). (F) Summary of abnormalities in p53-related genes in 21 sequenced PTCLs, with status of translocations involving DUSP22-IRF4 or ALK. There were 16 patient samples (“TCL” identifiers) and 6 cell lines (SR-786, Karpas [K] 299, SU-DHL-1, FEPD, MAC1, and MAC2A). MAC1 and MAC2A were considered together as they were derived from the same patient.
Figure 3
Figure 3
Validation and characterization of TBL1XR1/TP63 fusion in peripheral T-cell lymphomas. (A) Junction plot of mate-pair data showing inv(3)(q26q28) involving TBL1XR1 and TP63. Arrows indicate breakpoints. (B) Schematic diagram of inv(3)(q26q28) with resultant gene fusions. P indicates promoter region. (C) RT-PCR for fusion transcripts 1 and 2 in cases with (TCL29) and without (TCL32 and FE-PD) inv(3)(q26q28). (D) Partial results of Sanger sequencing (nucleotides in red) of TBL1XR1/TP63 (fusion transcript 2) in TCL29, with TP63 breakpoint (arrow) showing loss of transactivation (TA) domain and retention of DNA-binding domain (DBD), similar to TP63 isoforms encoding dominant-negative ΔNp63. (E) QPCR in 16 PTCL tissue samples shows higher expression of p63 in cases with inv(3)(q26q28) (n = 3) than in cases without this rearrangement (n = 13); TBL1XR1 is expressed more uniformly. (F) Western blot of protein from PTCL tissue samples without (TCL3) and with (TCL5) TBL1XR1/ΔNp63; the fusion protein runs at ∼ 100 kDa.
Figure 4
Figure 4
Clinicopathologic findings in peripheral T-cell lymphomas with TP63 rearrangements. (A) Dual-fusion (D-) and/or breakapart FISH probes were used to screen 190 PTCLs for TP63 rearrangements. In this case, D-FISH showed 2 abnormal fusion signals (arrows), corresponding to fusion of TBL1XR1 (green) to TP63 (red). The remaining green and red signals represent the nonrearranged copies of TBL1XR1 and TP63, respectively. (B) Most PTCLs with TP63 rearrangements showed a diffuse, sheet-like growth pattern (hematoxylin and eosin, 100× magnification; image acquired using an Olympus DP71 camera and Olympus BX51 microscope). (C) All rearranged cases demonstrated apoptotic debris, and 4 of 11 cases had prominent tingible body macrophages (TBM) phagocytozing cellular debris (1000×). Mitotic figures (MF) also were present. TC indicates tumor cells. (D) Immunohistochemistry of the tumor shown in panels A through C shows strong, uniform nuclear staining for p63 protein (400×). Virtually all tumor cells express the proliferation marker Ki67, as well as the lymphocyte activation marker, CD30. Top right panel indicates isotype control antibody. (E) Associations between TP63 rearrangement and results of immunohistochemical studies. (F) PTCL patients with TP63 rearrangements (n = 11) had significantly poorer overall survival than those without TP63 rearrangements (n = 179; median survival with and without rearrangements, 17.9 months vs 33.4 months, respectively).
Figure 5
Figure 5
TP63 rearrangements in DLBCLs. (A) DLBCL with TP63 rearrangement (hematoxylin and eosin, 400×). (B) Immunohistochemistry for the B-cell antigen, CD20 (400×). (C) Tumor cells showed strong nuclear expression of p63 protein (400×; inset, isotype control). (D) Dual-fusion FISH showed 2 fusion signals (arrows), corresponding to TBL1XR1/TP63 fusion. (E) TP63 rearrangements were seen in 1.2% of DLBCLs by FISH. The SnowShoes fusion detection algorithm did not identify TP63 fusions in transcriptome data from carcinomas (ca) of the breast, lung, or head and neck (H&N), nor in data from normal controls.

References

    1. Savage KJ, Chhanabhai M, Gascoyne RD, Connors JM. Characterization of peripheral T-cell lymphomas in a single North American institution by the WHO classification. Ann Oncol. 2004;15(10):1467–1475. - PubMed
    1. Savage KJ, Harris NL, Vose JM, et al. ALK- anaplastic large-cell lymphoma is clinically and immunophenotypically different from both ALK+ ALCL and peripheral T-cell lymphoma, not otherwise specified: report from the International Peripheral T-Cell Lymphoma Project. Blood. 2008;111(12):5496–5504. - PubMed
    1. WHO Classification of Tumours of Haematopoietic and Lymphoid Tissues. In: Swerdlow S, Campo E, Harris N, et al., editors; Bosman F, Jaffe E, Lakhani S, Ohgaki H, editors. World Health Organization Classification of Tumours. 4 Ed. Lyon, France: International Agency for Research on Cancer; 2008.
    1. Foss FM, Zinzani PL, Vose JM, Gascoyne RD, Rosen ST, Tobinai K. Peripheral T-cell lymphoma. Blood. 2011;117(25):6756–6767. - PubMed
    1. Gerber DE, Minna JD. ALK inhibition for non-small cell lung cancer: from discovery to therapy in record time. Cancer Cell. 2010;18(6):548–551. - PMC - PubMed

Publication types

MeSH terms