. 2012 Sep 20;120(12):2475-83.
doi: 10.1182/blood-2012-05-430736. Epub 2012 Jul 31.

Inhibition of apoptosis by BCL2 prevents leukemic transformation of a murine myelodysplastic syndrome

Affiliations

Inhibition of apoptosis by BCL2 prevents leukemic transformation of a murine myelodysplastic syndrome

Christopher I Slape et al. Blood. .

Abstract

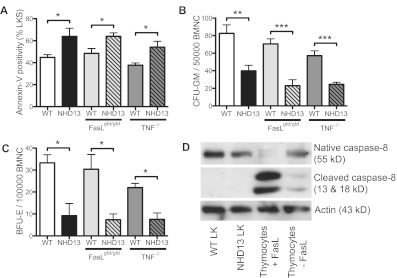
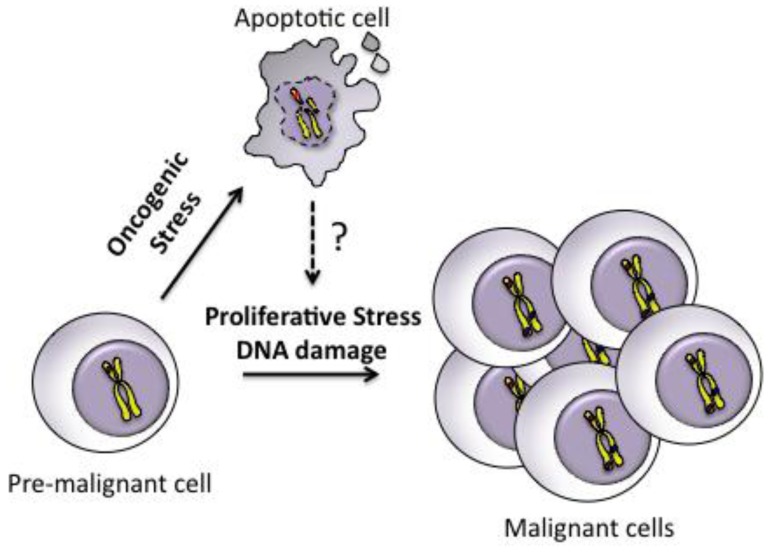
Programmed cell death or apoptosis is a prominent feature of low-risk myelodysplastic syndromes (MDS), although the underlying mechanism remains controversial. High-risk MDS have less apoptosis associated with increased expression of the prosurvival BCL2-related proteins. To address the mechanism and pathogenic role of apoptosis and BCL2 expression in MDS, we used a mouse model resembling human MDS, in which the fusion protein NUP98-HOXD13 (NHD13) of the chromosomal translocation t(2;11)(q31;p15) is expressed in hematopoietic cells. Hematopoietic stem and progenitor cells from 3-month-old mice had increased rates of apoptosis associated with increased cell cycling and DNA damage. Gene expression profiling of these MDS progenitors revealed a specific reduction in Bcl2. Restoration of Bcl2 expression by a BCL2 transgene blocked apoptosis of the MDS progenitors, which corrected the macrocytic anemia. Blocking apoptosis also restored cell-cycle quiescence and reduced DNA damage in the MDS progenitors. We expected that preventing apoptosis would accelerate malignant transformation to acute myeloid leukemia (AML). However, contrary to expectations, preventing apoptosis of premalignant cells abrogated transformation to AML. In contrast to the current dogma that overcoming apoptosis is an important step toward cancer, this work demonstrates that gaining a survival advantage of premalignant cells may delay or prevent leukemic progression.


Figures

Figure 1
Figure 1
Increased apoptosis in BM from 3-month-old NHD13 mice. (A) Hematocrit (HCT), red cell mean cell volume (MCV), and platelet and neutrophil counts of 3-month-old NHD13 mice (n = 5) and WT (WT) littermate controls (n = 5). (B) Proportions of annexin-V–positive and cleaved (ie, active) caspase-3–positive LKS cells from WT and NHD13 mice assessed by FACS (n = 3 of each genotype). (C) Representative FACS plots from cell-cycle analysis of WT and NHD13 LKS cells, and collated data showing cell-cycle distribution (G0, G1, and combined S/G2/M) in WT (n = 6) and NHD13 (n = 4). * indicates G0 P < .05 difference from WT. (D) Representative FACS plots and proportions of FLK2+ LKS (n = 3 per genotype). (E) Numbers of granulocyte and macrophage colonies (CFU-GM), BFU-E, and megakaryocytic colonies (Meg-CFC) in BM from WT and NHD13 mice (n = 3 per genotype). (F) Giemsa stain of granulocytes colonies grown in semisolid agar demonstrating apoptotic bodies (arrows) in NHD13 granulocyte colonies. Error bars throughout represent the SEM (*P < .05; **P < .01; ***P < .001).
Figure 2
Figure 2
The apoptosis in NHD13 progenitors is not mediated by the death receptor pathway. (A) Proportions of annexin-V–positive LKS cells assessed by FACS (n = 3 of each geneotype). (B) CFU-GM and (C) BFU-E numbers in WT and NHD13 BM on WT, FasLgld/gld or TNF−/− backgrounds (n = 3 of each genotype). (D) Western blot showing the presence of native and cleaved (active) caspase 8 in WT LK cells, NHD13 LK cells, WT thymocytes treated with or without FasL. Actin is shown as a loading control. All experiments performed using 3-month-old mice. Error bars represent the SEM (*P < .05; ***P < .001).
Figure 3
Figure 3
Bcl2 expression is reduced in NHD13 LK cells. (A) Quantification of Bcl2 levels by qRT-PCR in LK cells from WT and NHD13 mice (n = 3 of each genotype, each sample is a pool of 3 mice) and marrow cells from NHD13 mice which developed AML (n = 5; **P < .01). (B) Representative histograms of Bcl2 protein in WT and NHD13 LK cells measured by FACS. The dashed lines represent the isotype controls. The mean cell fluorescence of Bcl2 protein in NHD13 LK cells relative to WT LK cells was calculated from 3-month-old mice (n = 3 of each genotype).
Figure 4
Figure 4
Enforced BCL2 expression inhibits the excess apoptosis of NHD13 hematopoietic progenitors. (A) Proportions of annexin-V–positive LKS cells from WT, NHD13, BCL2, and NHD13/BCL2 mice (n = 3 of each genotype). (B) Proportions of LKS cells in BM from 3 mice of each genotype. (C) CFU-GM and BFU-E numbers in BM from 3 mice of each genotype. (D) Hematocrit (HCT), red cell mean cell volume (MCV), and platelet count of 5 mice of each genotype. All measurements were made on 3-month-old mice. Error bars represent the SEM (NS indicates P > .05; *P < .05; **P < .01; ***P < .001).
Figure 5
Figure 5
BCL2 prevents transformation of MDS to AML in NHD13 mice. (A) Kaplan-Meier AML-free survival of WT (n = 20), NHD13 (n = 34), BCL2 (n = 23), and NHD13/BCL2 (n = 29) mice. Mice that died from causes other than AML were censored at time of death. Note that WT, BCL2, and NHD13/BCL2 lines are overlaid (indicated by A). (B) Q-RT-PCR analysis of HoxA9, HoxB7, HoxC6, and Pbx3 expression in LK cells of each indicated genotype (n = 3 of each genotype). (C) T-ALL–free survival in the same cohorts of mice. Mice that died from causes other than T-ALL were censored at time of death. Note that the WT and BCL2 lines are overlaid (indicated by A). (D) Overall survival of the same cohorts of mice. P values indicate difference from the survival of NHD13 mice. (*P < .05; **P < .01; ***P < .001).
Figure 6
Figure 6
BCL2 restores cell-cycle quiescence and limits DNA damage in NHD13 progenitors. (A) Cell-cycle distribution (G0, G1, and combined S/G2/M) of LKS cells from WT (n = 6), NHD13 (n = 4), BCL2 (n = 5), and NHD13/BCL2 (n = 5) mice (* indicates G0 P < .05 difference from WT). (B) Cdkn1a mRNA expression in LK cells from 3 mice of each genotype. (C) FACS quantification of γH2AX levels in nonapoptotic (caspase-3–negative) LK cells from 3 mice of each genotype (NS indicates P > .05; *P < .05).
Figure 7
Figure 7
Model of how apoptosis can promote malignant transformation of premalignant cells. Premalignant cells harboring a single oncogenic lesion undergo apoptosis triggered by oncogenic stress. Apoptosis promotes proliferative stress and DNA damage through unknown mechanisms, which leads to genomic instability and accumulation of additional genetic events necessary for progression to an aggressive malignancy.

References

    1. Tefferi A, Vardiman JW. Myelodysplastic syndromes. N Engl J Med. 2009;361(19):1872–1885. - PubMed
    1. Youle RJ, Strasser A. The BCL-2 protein family: opposing activities that mediate cell death. Nat Rev Mol Cell Biol. 2008;9(1):47–59. - PubMed
    1. Kerbauy DB, Deeg HJ. Apoptosis and antiapoptotic mechanisms in the progression of myelodysplastic syndrome. Exp Hematol. 2007;35(11):1739–1746. - PMC - PubMed
    1. Barlow JL, et al. A p53-dependent mechanism underlies macrocytic anemia in a mouse model of human 5q- syndrome. Nat Med. 2010;16(1):59–66. - PMC - PubMed
    1. Halazonetis TD, Gorgoulis VG, Bartek J. An oncogene-induced DNA damage model for cancer development. Science. 2008;319(5868):1352–1355. - PubMed

Publication types

MeSH terms