. 2012 Sep 15;189(6):2805-14.
doi: 10.4049/jimmunol.1200645. Epub 2012 Aug 1.

The development and function of memory regulatory T cells after acute viral infections

Affiliations

The development and function of memory regulatory T cells after acute viral infections

Ana M Sanchez et al. J Immunol. .

Abstract

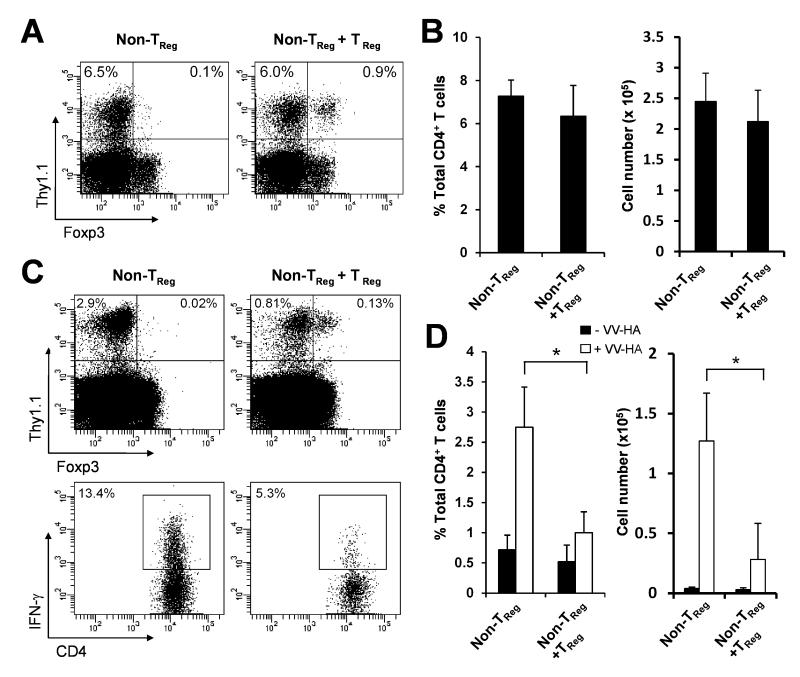
Natural CD4+CD25+Foxp3+ regulatory T cells (Tregs) are critical for the control of immune responses to pathogens. However, most studies have focused on chronic infections, in which pathogen-specific Tregs contribute to pathogen persistence and, in some cases, concomitant immunity. How Tregs behave and function following acute infections remains largely unknown. In this article, we show that pathogen-specific Tregs can be activated and expand upon acute viral infections in vivo. The activated Tregs then contract to form a memory pool after resolution of the infection. These memory Tregs expand rapidly upon a secondary challenge, secrete large amounts of IL-10, and suppress excessive immunopathological conditions elicited by recall expansion of non-Tregs via an IL-10-dependent mechanism. Our work reveals a memory Treg population that develops after acute viral infections and may help in the design of effective strategies to circumvent excessive immunopathological effects.


Figures

Figure 1
Figure 1
Activation and expansion of pathogen-specific TReg upon an acute viral infection. Purified naïve HA-specific TReg or non-TReg (Thy1.1+) were transferred into B10.D2 mice (Thy1.2+) which were subsequently infected with VV-HA or left uninfected as a control. 7 days after infection, mice were harvested for the following analyses. (A) Splenocytes were stained with anti-CD4, anti-Thy1.1 and anti-Foxp3, and the mean percentages of TReg (CD4+Thy1.1+Foxp3+) or non-TReg (CD4+Thy1.1+Foxp3) among total lymphocytes as well as their absolute cell numbers were plotted with the standard deviations included. (B) Splenocytes were stained with anti-CD4, anti-Thy1.1, anti-Foxp3 and anti-IFN-γ. The percentage of TReg or non-TReg among total lymphocytes is indicated (top panels). The percentage of IFN-γ+ TReg among CD4+Thy1.1+Foxp3+ TReg and that of IFN-γ+ non-TReg among CD4+Thy1.1+Foxp3 non-TReg are indicated (bottom panels). (C) Splenocytes were stained with anti-CD4, anti-Thy1.1, anti-Foxp3 and anti-CD62L or anti-CD44 and subjected to FACS analysis. (D) Purified Foxp3-GFP+ TCR-HA+ TReg were transferred into BALB/c mice, which were subsequently infected intraperitoneally with VV-HA (+VV-HA) or left uninfected (−VV-HA) as a control. 7 days after infection, splenocytes were harvested and stained with anti-CD4. The percentage of Foxp3-GFP+ donor TReg among CD4+ T cells is shown. Results are representative of three independent experiments.
Figure 2
Figure 2
Activated pathogen-specific TReg undergo contraction to form a memory population after resolution of infection. Purified naïve HA-specific TReg or non-TReg (Thy1.1+) were transferred into B10.D2 mice (Thy1.2+), which were subsequently infected with VV-HA or left uninfected as a control. (A) 7, 14, 28 and 50 days after infection, splenocytes were stained with anti-CD4, anti-Thy1.1 and anti-Foxp3, and the mean percentage of TReg (CD4+Thy1.1+ Foxp3+) or non-TReg (CD4+Thy1.1+Foxp3) among total lymphocytes was plotted with the standard deviations included. (B) 50 days after infection, splenocytes were stained with anti-CD62L, anti-CD4, anti-Thy1.1 and anti-Foxp3. Events were gated on CD4+Thy1.1+Foxp3+ (TReg) or CD4+Thy1.1+Foxp3 (non-TReg). (C-D) 50 days after infection, mice were rechallenged with Ad-HA (+AdHA) or left uninfected as a control (−AdHA). 4 days after rechallenge, splenocytes were stained with anti-CD4, anti-Thy1.1 and anti-Foxp3. The percentage of CD4+Thy1.1+Foxp3+ (TReg) or CD4+Thy1.1+Foxp3 (non-TReg) among total CD4+ T cell is indicated (C). The mean percentages of TReg and non-TReg among total CD4+ T cells as well as their absolute cell numbers were plotted with the standard deviations included (D). Results are representative of three independent experiments.
Figure 3
Figure 3
Memory TReg suppress the expansion of non-TReg memory CD4+ T cells in the liver. Purified naïve HA-specific non-TReg with (TReg + Non-TReg) or without TReg (Non-TReg) were transferred into B10.D2 mice, which were infected with VV-HA. (A-B) 7 days after infection, splenocytes were harvested and stained with anti-CD4, anti-Thy1.1 and anti-Foxp3. The percentages of CD4+Thy1.1+Foxp3+ TReg and CD4+Thy1.1+Foxp3 non-TReg within the CD4+ T cell gate are indicated (A). The mean percentages of CD4+Thy1.1+Foxp3 non-TReg among total CD4+ T cells as well as their absolute cell numbers were plotted with the standard deviations included (B). (C-D) 50 days after infection, mice were rechallenged with Ad-HA (+AdHA) or left uninfected as a control (−AdHA). 4 days after rechallenge, splenocytes were harvested and analyzed for expansion and function. The percentages of CD4+Thy1.1+Foxp3+ and CD4+Thy1.1+Foxp3 within the CD4+ T cell gate are indicated (top panels). The percentage of IFN-γ+ non-TReg among CD4+Thy1.1+Foxp3 is indicated (bottom panels) (C). The mean percentages of CD4+Thy1.1+Foxp3 non-TReg non-TReg among total CD4+ T cells as well as their absolute cell numbers were plotted with the standard deviations included (D), *p <0.001. Results are representative of three independent experiments.
Figure 4
Figure 4
Memory TReg suppress the expansion of non-TReg memory CD4+ T cells in the lungs. Purified naïve HA-specific non-TReg with (TReg + Non-TReg) or without TReg (Non-TReg) were transferred into B10.D2 mice, which were infected with influenza virus. (A-B) 7 days after infection, draining hilar lympocytes were harvested and stained with anti-CD4, anti-Thy1.1 and anti-Foxp3. The percentages of CD4+Thy1.1+Foxp3+ and CD4+Thy1.1+Foxp3 within the CD4+ T cell gate are indicated (A). The mean percentages of CD4+Thy1.1+Foxp3 non-TReg among total CD4+ T cells as well as their absolute cell numbers were plotted with the standard deviations included (B). (C-D) 50 days after infection, mice were rechallenged with VV-HA (+VV-HA) or left uninfected as a control (−VV-HA). 5 days after rechallenge, draining hilar lympocytes were harvested and analyzed for expansion and function. The percentages of CD4+Thy1.1+Foxp3+ and CD4+Thy1.1+Foxp3 within the CD4+ T cell gate are indicated (top panels) and the percentage of IFN-γ+ non-TReg among CD4+Thy1.1+Foxp3 is indicated (bottom panels) (C). The mean percentages of CD4+Thy1.1+Foxp3 non-TReg among total CD4+ T cells as well as their absolute cell numbers were plotted with the standard deviations included (D), *p <0.001. Results are representative of three independent experiments.
Figure 5
Figure 5
Memory TReg control the extent of liver immunopathology during a recall response. Purified naïve HA-specific non-TReg with (TReg + Non-TReg) or without TReg (Non-TReg) were transferred into B10.D2 mice which were infected with VV-HA. 50 days after infection, mice were rechallenged with Ad-HA, and 4 days after rechallenge, liver tissues were harvested and examined for histopathology and infiltrating lymphocytes. (A) Paraffin sections were stained with H & E (left panel) and cryosections were stained with anti-CD4 (Green) and anti-HA (Red) by immunofluorescence. The arrowhead indicates periportal infiltration. (B) Paraffin sections were stained with H & E and evaluated for evidence of pathological changes by light microscopic examination. Sections were characterized with respect to periportal inflammation, periportal degeneration and focal necrosis, and intralobular degeneration and focal necrosis. Extent of pathology was scored from 0 (no pathology) to 4 (severe pathology). (C) The mean numbers of CD4+ T cells/ field of view were plotted with the standard deviations included, *p <0.001. (D) Accumulation of TReg at the site of infection following antigen rechallenge. Purified naïve HA-specific non-TReg and TReg were transferred into B10.D2 mice, which were infected with VV-HA intraperitoneally. 50 days after infection, mice were rechallenged with Ad-HA (+Ad-HA) or left uninfected as a control (−Ad-HA). 4 days after rechallenge, lymphocytes were harvested from the liver and analyzed for HA-specific TReg. The mean percentages of HA-specific TReg among total CD4+ T cells as well as their absolute cell numbers were plotted with the standard deviations included. Results are representative of three independent experiments.
Figure 6
Figure 6
Memory TReg control the extent of lung immunopathology during a recall response. Purified naïve HA-specific non-TReg with (TReg + Non-TReg) or without TReg (Non-TReg) were transferred into B10.D2 mice which were infected with influenza virus. 50 days after infection, mice were rechallenged with VV-HA. 5 days after rechallenge, lung tissues were harvested and analyzed for immunopathology. (A) Cryosections were stained with hematoxylin (left panel) or with anti-CD4 (Green) by immunofluorescence (right panel). The arrowhead indicates peribronchial infiltration. (B) Cryosections were stained with hematoxylin and evaluated for evidence of pathological changes by light microscopic examination. Sections were characterized with respect to perivascular and peribronchial infiltration. Extent of pathology was scored from 0 (no pathology) to 4 (severe pathology). The mean score for ten fields of view from at least three cryosections per group was graphed with the standard error included. Results are representative of three independent experiments.
Figure 7
Figure 7
Memory TReg suppress the expansion of non-TReg memory CD4+ T cells via IL-10. (A-C) Purified naïve HA-specific non-TReg with (TReg + Non-TReg) or without TReg (Non-TReg) were transferred into B10.D2 mice and infected with influenza virus. 50 days after infection, mice received anti-IL-10R, anti-CTLA-4, anti-TGF-β, or a control IgG i.v. 6 hours prior to infection with VV-HA and again two days later. 5 days following rechallenge, draining hilar lymph nodes and lung tissue were harvested for analysis. (A) Hilar lymphocytes were harvested and stained with anti-CD4, anti-Thy1.1 and anti-Foxp3. The percentages of CD4+Thy1.1+Foxp3+ TReg and CD4+Thy1.1+Foxp3 non-TReg among total CD4+ T cells are indicated. (B) The mean percentages of CD4+Thy1.1+Foxp3 non-TReg among total CD4+ T cells were plotted with the standard deviations included, *p <0.01. (C) Cryosections of lung tissue were stained with hematoxylin. Arrowheads indicate peribronchial infiltration. (D-E) Purified naïve HA-specific TReg (Thy1.1+) were transferred into B10.D2 mice and infected with influenza virus or left uninfected (naïve). HA-specific TReg were analyzed 7 (D7) and 50 (D50) days post-infection, as well as five days after antigen rechallenge (D50+boost), which was done 50 days after initial infection. (D) HA-specific TReg were purified by staining pooled cells from the lymph nodes and spleen with anti-CD4 and anti-Thy1.1 to sort CD4+Thy1.1+ TReg. mRNA was isolated from naïve, D7, D50 and D50 + boost TReg, and the levels of IL-10 and β-actin were measured by real-time RT-PCR. The relative quantities of mRNA, normalized to β-actin, from a representative sample are indicated. (E) HA-specific TReg were stained with anti-CD4, anti-Thy1.1, anti-Foxp3 and anti-IL-10 (intracellular, black) or isotype control (gray). The percentages of CD4+Thy1.1+Foxp3+ cells that are IL-10+ are indicated. Results are representative of three independent experiments.

References

    1. Baecher-Allan C, Viglietta V, Hafler DA. Human CD4+CD25+ regulatory T cells. Semin Immunol. 2004;16:89–98. - PubMed
    1. Shevach EM. CD4+ CD25+ suppressor T cells: more questions than answers. Nat Rev Immunol. 2002;2:389–400. - PubMed
    1. McHugh RS, Whitters MJ, Piccirillo CA, Young DA, Shevach EM, Collins M, Byrne MC. CD4(+)CD25(+) immunoregulatory T cells: gene expression analysis reveals a functional role for the glucocorticoid-induced TNF receptor. Immunity. 2002;16:311–323. - PubMed
    1. Shimizu J, Yamazaki S, Takahashi T, Ishida Y, Sakaguchi S. Stimulation of CD25(+)CD4(+) regulatory T cells through GITR breaks immunological self-tolerance. Nat Immunol. 2002;3:135–142. - PubMed
    1. Yamaguchi T, Hirota K, Nagahama K, Ohkawa K, Takahashi T, Nomura T, Sakaguchi S. Control of immune responses by antigen-specific regulatory T cells expressing the folate receptor. Immunity. 2007;27:145–159. - PubMed

Publication types

MeSH terms