. 2012 Aug 1;32(31):10522-9.
doi: 10.1523/JNEUROSCI.1138-12.2012.

Traveling waves on the organ of corti of the chinchilla cochlea: spatial trajectories of inner hair cell depolarization inferred from responses of auditory-nerve fibers

Affiliations

Traveling waves on the organ of corti of the chinchilla cochlea: spatial trajectories of inner hair cell depolarization inferred from responses of auditory-nerve fibers

Andrei N Temchin et al. J Neurosci. .

Abstract

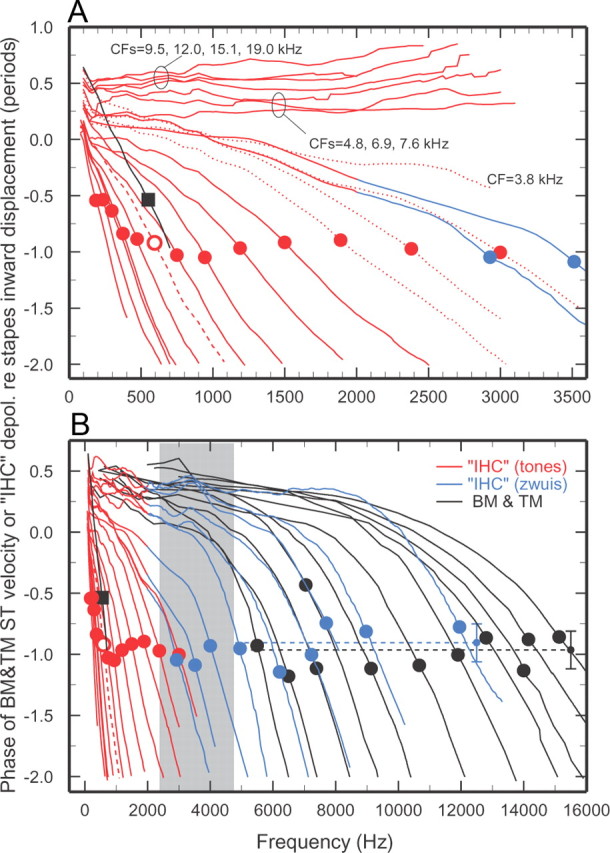
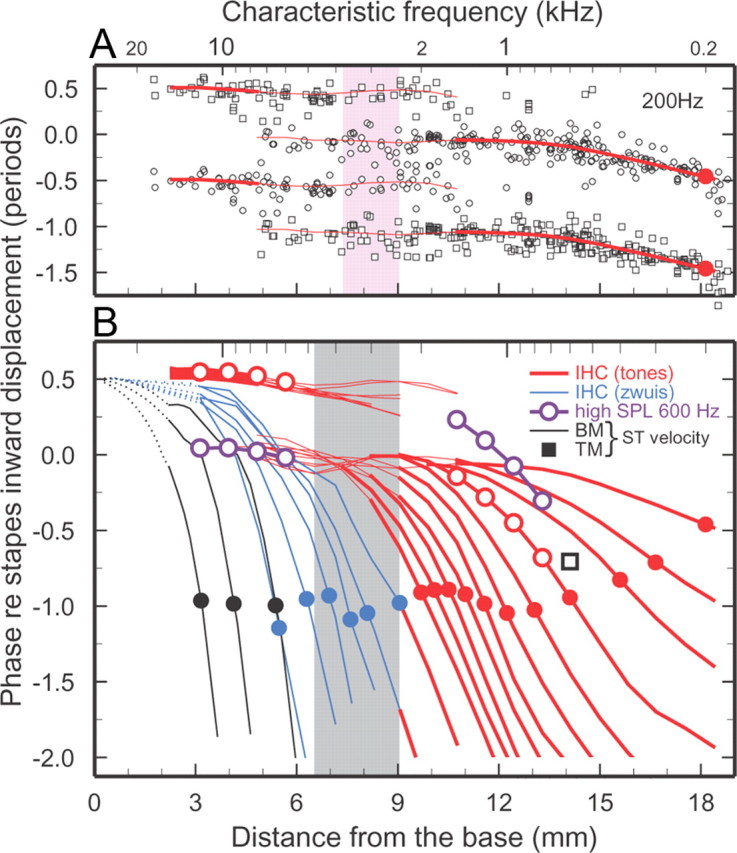
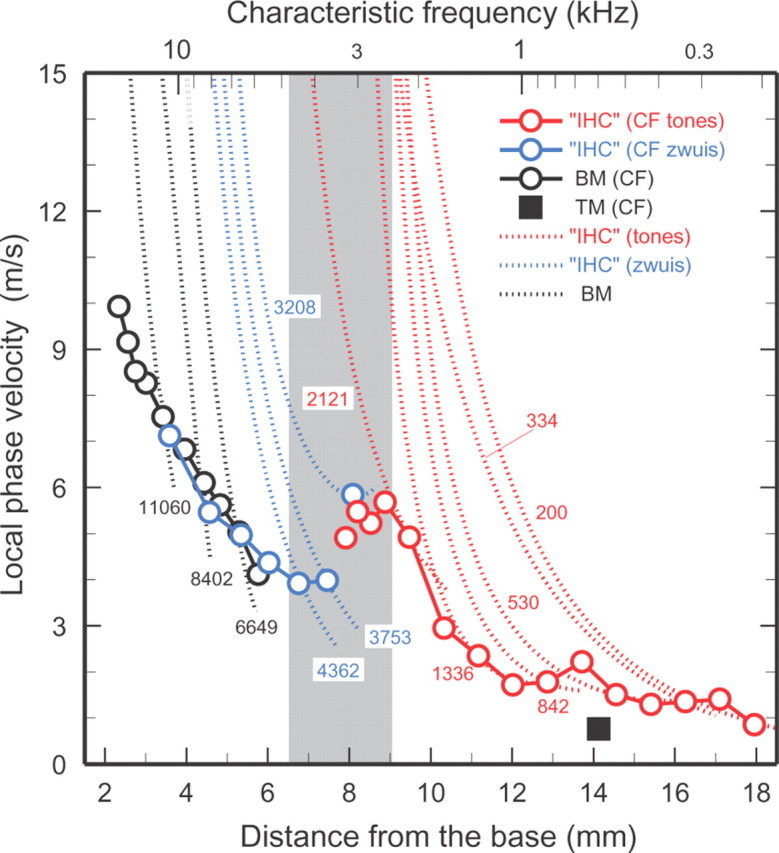
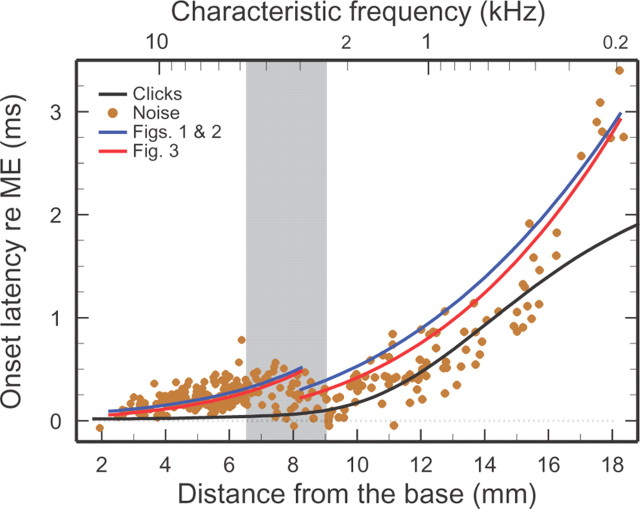
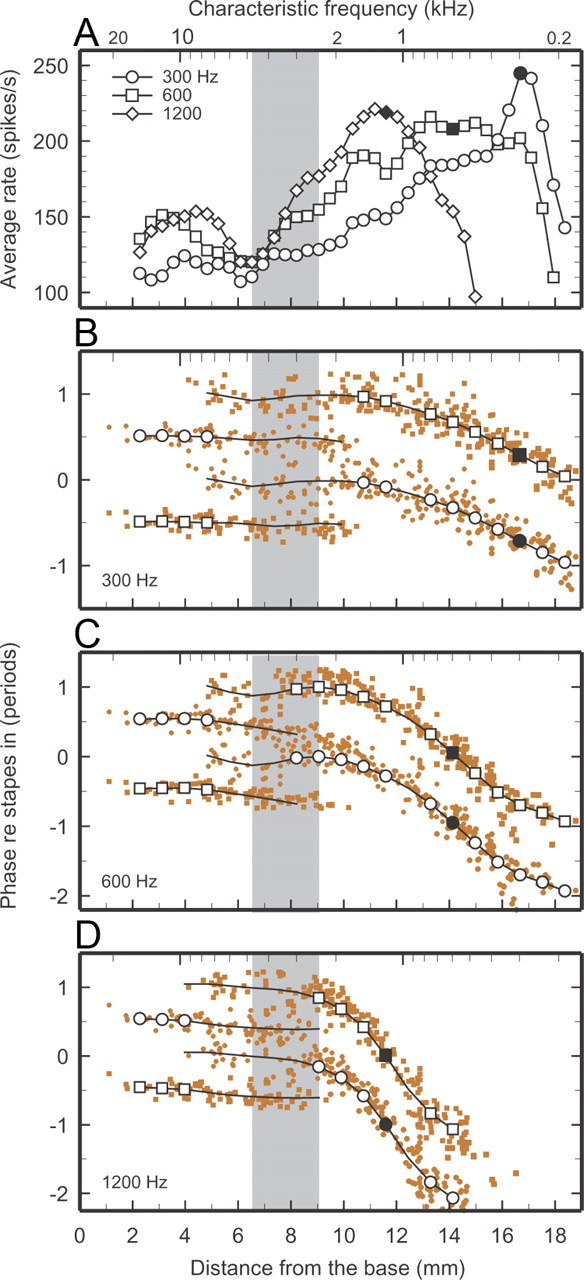
Spatial magnitude and phase profiles for inner hair cell (IHC) depolarization throughout the chinchilla cochlea were inferred from responses of auditory-nerve fibers (ANFs) to threshold- and moderate-level tones and tone complexes. Firing-rate profiles for frequencies ≤2 kHz are bimodal, with the major peak at the characteristic place and a secondary peak at 3-5 mm from the extreme base. Response-phase trajectories are synchronous with peak outward stapes displacement at the extreme cochlear base and accumulate 1.5 period lags at the characteristic places. High-frequency phase trajectories are very similar to the trajectories of basilar-membrane peak velocity toward scala tympani. Low-frequency phase trajectories undergo a polarity flip in a region, 6.5-9 mm from the cochlear base, where traveling-wave phase velocity attains a local minimum and a local maximum and where the onset latencies of near-threshold impulse responses computed from responses to near-threshold white noise exhibit a local minimum. That region is the same where frequency-threshold tuning curves of ANFs undergo a shape transition. Since depolarization of IHCs presumably indicates the mechanical stimulus to their stereocilia, the present results suggest that distinct low-frequency forward waves of organ of Corti vibration are launched simultaneously at the extreme base of the cochlea and at the 6.5-9 mm transition region, from where antiphasic reflections arise.


Figures

Figure 1.
Figure 1.
Phase-frequency curves for IHC depolarization and BM and TM vibrations. A, Presents the data of B (CFs ≤3 kHz) using an expanded frequency scale. Phases are referred to inward displacement of the middle-ear ossicles [for IHCs, see Ruggero et al. (1990), their Fig. 11]. Red traces: IHC phase-frequency curves derived from averages of responses to tones of many ANFs with CFs (red circles) within nonoverlapping 1/3-octave bands [Temchin and Ruggero (2010), their Fig. 10]. Dotted red traces in A indicate data for CFs in the transition region (gray band), which have exceptionally large SDs for low stimulus frequencies. Blue traces: IHC phase-frequency curves derived from averages of responses to tone complexes (“zwuis” stimuli) (van der Heijden and Joris, 2003), anchored to the phases of responses to tones (van der Heijden and Joris, 2005; Cai et al., 2009). The blue traces for central CFs of 2.9, 3.5, 4, 4.9, 6.2, 7.2, 7.7, 9, and 12 kHz (blue circles) represent, respectively, 5, 6, 10, 7, 8, 7, 7, 4, and 5 ANFs. B, The overall mean phase (−0.91 period) is indicated by the blue dashed trace and small symbol, with ±SD (0.15 period) indicated by the vertical blue bracket. BM and TM curves (black traces) indicate peak velocity toward scala tympani. The BM curves (CFs, filled circles) represent all available measurements in chinchilla ears in which middle-ear vibrations were also recorded [Rhode and Recio (2000), their Figs. 5B, 6B; Recio and Rhode (2000), their Fig. 6A,B; Narayan and Ruggero (2000), their Fig. 2; Ruggero et al. (1997), their Fig. 15]; and unpublished data of A. Recio-Spinoso and W.S. Rhode. Most of the BM curves are averages of measurements at two or three sites. The overall BM mean phase (−0.97 period) is indicated by the black dashed trace and small symbol, with ±SD (0.21 period) indicated by the vertical black bracket. The TM curve (average CF = 600 Hz; filled square) represents measurements in six chinchillas [Rhode and Cooper (1996), their Fig. 5B]. Gray band: CF range where ANF tuning curves change their shape [Temchin et al. (2008), their Fig. 7B]. IHC phases inferred from responses to tones of 434 ANFs in 63 chinchillas and tones complexes (selected from a total of 65 ANFs in 17 chinchillas).
Figure 2.
Figure 2.
Phase-place curves for BM and TM vibrations and IHC depolarization in the chinchilla cochlea. A, Open symbols indicate average phases of IHC depolarization, inferred from responses of 346 ANFs, for stimulation with 200-Hz tones presented at 70 dB SPL. Each data point is plotted twice as a circle and a square separated by one period. The traces indicate central trends, computed over 1/3-octave bands, which are also plotted in B. The thick traces indicate regions in which response phases are clustered unambiguously around a single trajectory. Thin traces indicate regions in which phases are clustered around parallel tracks with dual polarities. (See Materials and Methods for the procedure followed in determining phase ambiguity and for computing single or double trajectories.) The solid red circles indicate phase at the 200-Hz characteristic place. The area shaded in pink corresponds to the region where responses to 200-Hz tones presented at threshold flip their polarity [Ruggero and Rich (1987), their Fig. 4]. B, Each curve represents the variation of phase with distance for a single frequency, relative to peak inward displacement of the stapes. BM peak velocity toward scala tympani: black traces. IHC-depolarization phases were inferred from ANF responses to tones presented at 70 dB SPL (red; 200, 300, and 400–2000 Hz, every 200 Hz), 600-Hz tones (violet) presented at 90–100 and 100–110 dB SPL at apical and basal regions, respectively [Ruggero et al. (1996), their Figs. 3, 7], and from near-threshold tone complexes (blue). IHC phases were determined by correcting ANF phases for 0.96 ms neural/synaptic delays. For responses to tones, averages were computed for nonoverlapping 1/3-octave CF bands. To avoid clutter, the corresponding phases are represented solely as red traces except for two ranges where open red circles indicate responses to tones presented at 70 dB SPL and open violet circles indicate responses to tones presented at 90–100 and 100–110 dB SPL. Solid circles indicate phases at the characteristic places. Black square: average phase of peak velocity toward scala tympani for TM responses to 600-Hz tones at sites with corresponding CFs in two cochleae (Rhode and Cooper, 1996). Cochlear distance corresponds to the map of Müller et al. (2010). Gray band marks the region where ANF tuning curves change their shape [Temchin et al. (2008), their Fig. 7B]. IHC phase data derived from the same ANF populations represented in Figure 1.
Figure 3.
Figure 3.
Local phase velocities of IHC depolarization and of BM and TM vibrations in the chinchilla cochlea. Dotted traces: local traveling-wave phase velocities for the indicated frequencies (200–11060 Hz), computed from the phase-place curves of Figure 2. Black traces: BM vibrations. IHC velocities were inferred from ANF responses to tones (red) and tone complexes (blue). Open symbols: velocities at the characteristic places, computed from Figure 1. Apical TM vibration velocity at CF (black square) is from Cooper and Rhode (1996). Gray band marks the region where ANF tuning curves change their shape [Temchin et al. (2008), Fig. 7B] and where IHC responses change their polarity (Fig. 2). IHC phase velocities derived from the same ANF populations represented in Figures 1 and 2.
Figure 4.
Figure 4.
Onset latencies of IHC impulse responses plotted against cochlear place. Onset latencies of IHC depolarization (filled color symbols) were estimated from the time-domain onsets of Wiener kernels for ANF responses to low-level white noise, which resemble impulse responses but are dominated by frequencies near CF. The black trace indicates the signal-front delay, i.e., the onset latency of BM responses to intense clicks [Temchin et al. (2005), their Fig. 13A]. The Wiener-kernel latencies are longer than signal-front delays because the latter include spectral components that travel at higher speeds than near-CF frequencies (“frequency dispersion”). Onset latencies of IHC depolarization were also estimated from the CF phases of Figures 1 and 2 (blue traces) and by spatial integration of the velocity curves of Figure 3 between 0 mm and the characteristic places (red traces). In the basal region, the latencies measured by the two procedures fully coincided. Therefore, for the sake of display clarity, the red trace was displaced downward by 25 μs. All latencies have been corrected for neural/synaptic (0.96 ms) and middle-ear delays. Gray band marks the region where ANF tuning curves change their shape, IHC responses change their polarity (Fig. 2), and traveling wave velocities attain a local maximum (Fig. 3). Wiener-kernel data recorded from 303 ANFs in 40 chinchillas.
Figure 5.
Figure 5.
Spatial profiles of average rates and phases of ANF responses to tones. Color symbols in B–D indicate depolarization phases of individual IHCs inferred from ANF responses to tones presented at 70 dB SPL. Symbols for 300-, 600-, and 1200-Hz tones represent responses to 369, 394, and 318 ANFs, respectively, recorded from 54, 47, and 44 chinchillas. A, Connected black symbols indicate average rates computed over nonoverlapping sixth-octave CF bands and subjected to three-point smoothing. B, Black traces indicate average phase trajectories; open black symbols identify third-octave CF bands in which trajectories are unambiguous. (See Materials and Methods for the criterion used to define phase ambiguity and for the computation of single or double trajectories.) Filled black symbols indicate rates (A) and phases (B) at the characteristic places. Data from the same population of ANFs represented in Figures 1 and 2. Gray bands mark the region where ANF tuning curves change their shape (Fig. 1), IHC responses change their polarity (Fig. 2), traveling wave velocities attain a local maximum (Fig. 3), and latencies of near-threshold IHC impulse responses exhibit a local minimum (Fig. 4).

Similar articles

Cited by

References

    1. Cai H, Temchin AN, Ruggero MA. Phase-frequency functions for chinchilla auditory-nerve fibers with characteristic frequencies beyond the phase locking range. Paper presented at 32nd Association for Research in Otolaryngology Midwinter Meeting; February; San Diego, CA. 2009.
    1. Charaziak K, Siegel J. Evaluating frequency selectivity in humans and chinchillas with stimulus-frequency otoacoustic emission tuning curves. Paper presented at 35th Association for Research in Otolaryngology Midwinter Meeting; February; San Diego, CA. 2012.
    1. Chen F, Zha D, Fridberger A, Zheng J, Choudhury N, Jacques SL, Wang RK, Shi X, Nuttall AL. A differentially amplified motion in the ear for near-threshold sound detection. Nat Neurosci. 2011;14:770–774. - PMC - PubMed
    1. Cooper NP, Rhode WS. Fast travelling waves, slow travelling waves and their interactions in experimental studies of apical cochlear mechanics. Audit Neurosci. 1996;2:289–299.
    1. Cooper NP, Yates GK. Nonlinear input-output functions derived from the responses of guinea-pig cochlear nerve fibres: variations with characteristic frequency. Hear Res. 1994;78:221–234. - PubMed

Publication types

MeSH terms

LinkOut - more resources