. 2012 Aug 1;32(31):10594-608.
doi: 10.1523/JNEUROSCI.6045-11.2012.

Large-scale synchronized activity during vocal deviance detection in the zebra finch auditory forebrain

Affiliations

Large-scale synchronized activity during vocal deviance detection in the zebra finch auditory forebrain

Gabriël J L Beckers et al. J Neurosci. .

Abstract

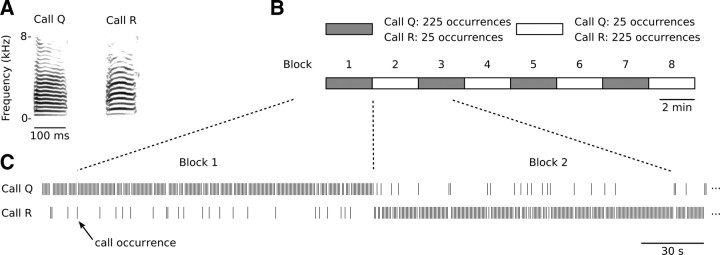
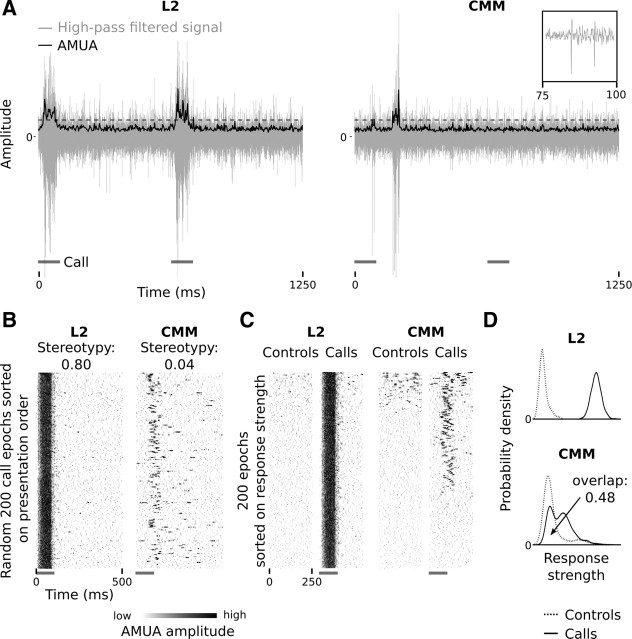
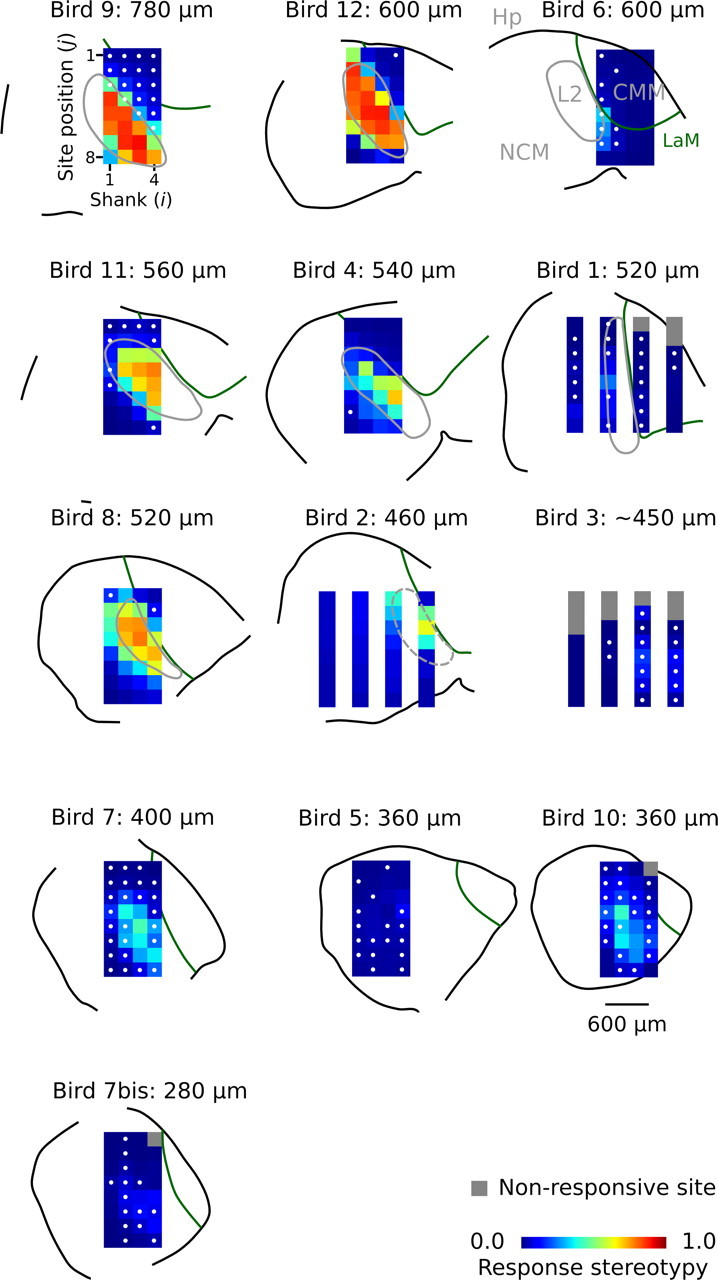
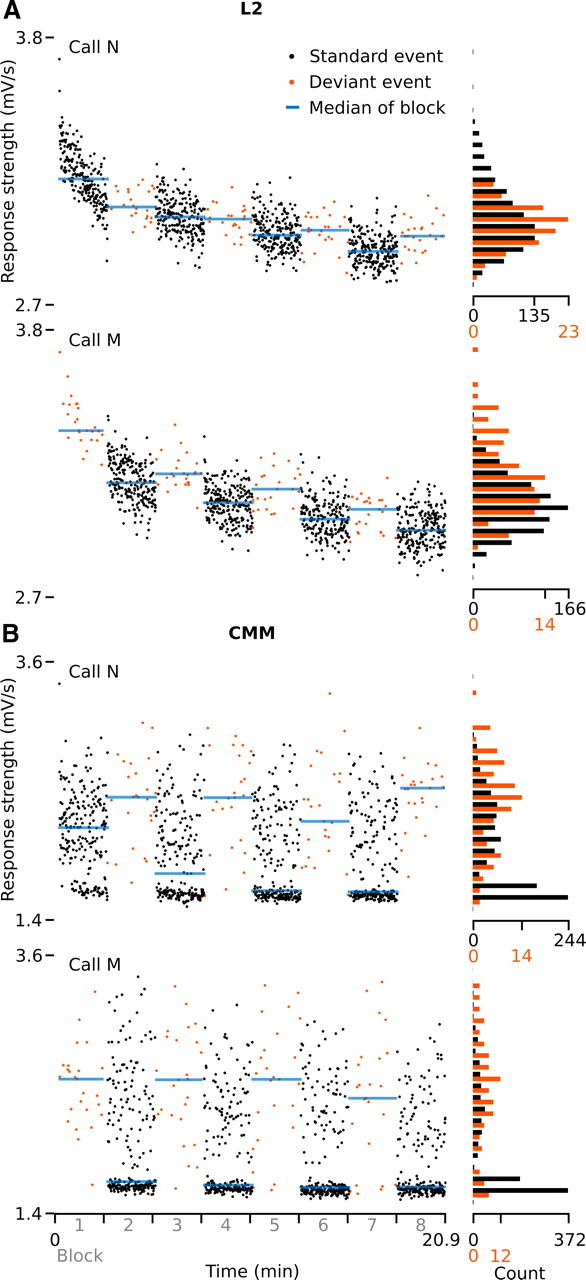
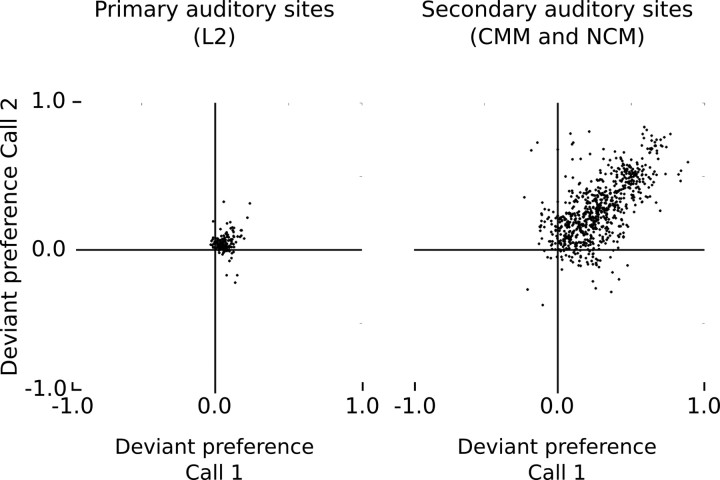
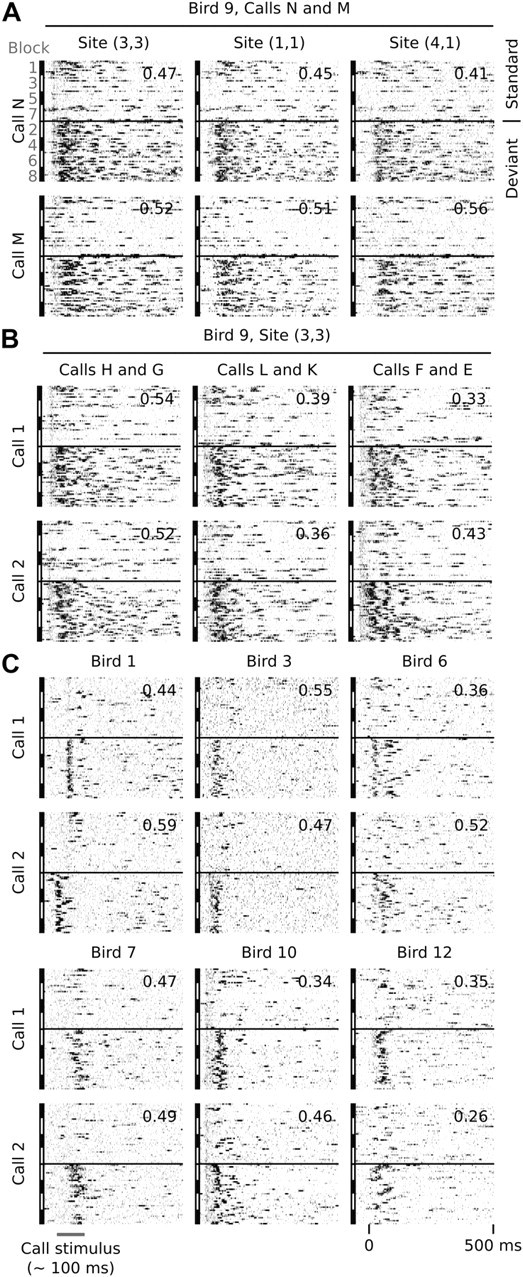
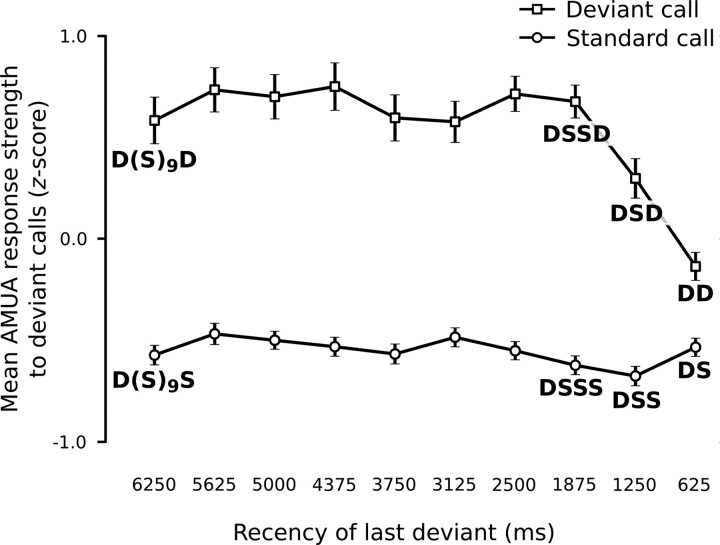
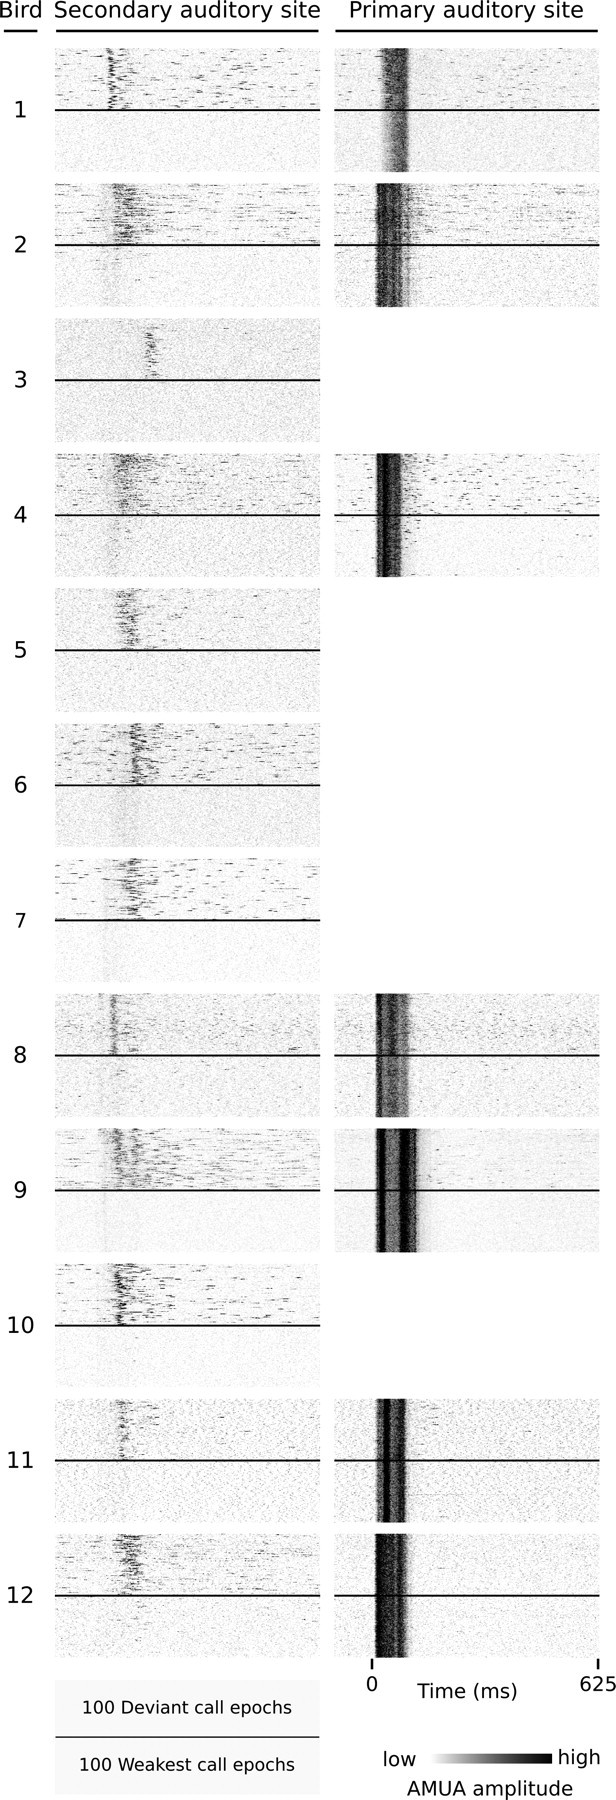
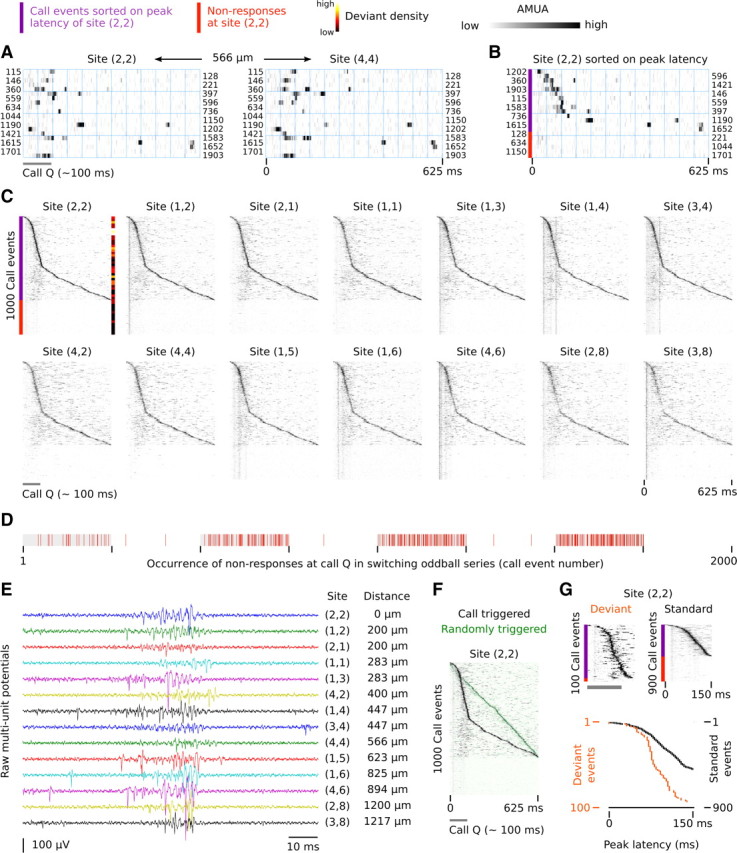
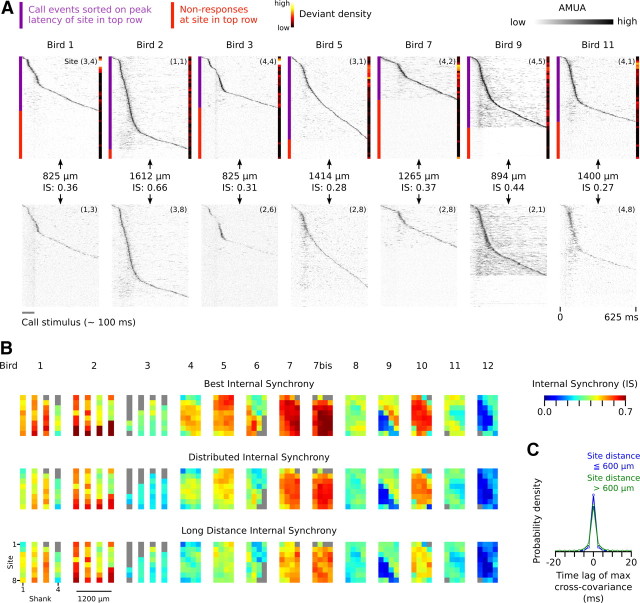
Auditory systems bias responses to sounds that are unexpected on the basis of recent stimulus history, a phenomenon that has been widely studied using sequences of unmodulated tones (mismatch negativity; stimulus-specific adaptation). Such a paradigm, however, does not directly reflect problems that neural systems normally solve for adaptive behavior. We recorded multiunit responses in the caudomedial auditory forebrain of anesthetized zebra finches (Taeniopygia guttata) at 32 sites simultaneously, to contact calls that recur probabilistically at a rate that is used in communication. Neurons in secondary, but not primary, auditory areas respond preferentially to calls when they are unexpected (deviant) compared with the same calls when they are expected (standard). This response bias is predominantly due to sites more often not responding to standard events than to deviant events. When two call stimuli alternate between standard and deviant roles, most sites exhibit a response bias to deviant events of both stimuli. This suggests that biases are not based on a use-dependent decrease in response strength but involve a more complex mechanism that is sensitive to auditory deviance per se. Furthermore, between many secondary sites, responses are tightly synchronized, a phenomenon that is driven by internal neuronal interactions rather than by the timing of stimulus acoustic features. We hypothesize that this deviance-sensitive, internally synchronized network of neurons is involved in the involuntary capturing of attention by unexpected and behaviorally potentially relevant events in natural auditory scenes.


Figures

Figure 1.
Figure 1.
The switching-oddball stimulation paradigm used in this study. A, Two representative short-range contact call stimuli that form the basis of a stimulation series. Call stimuli always originate from different individuals and are matched for duration and RMS level. B, A stimulation series consists of eight blocks, in each of which both call stimuli are presented, but in different frequencies. One call stimulus is played 225 times (standard) and the other one is played 25 times (deviant); from one block to the next, these frequencies are reversed. Thus, overall call stimuli are played equally often, but their probability of occurrence alternates back and forth from 10 to 90% between blocks. C, Calls are randomly intermixed so that call occurrences are probabilistic.
Figure 2.
Figure 2.
Examples of response properties to call stimuli in the primary auditory area L2 and the secondary auditory area CMM. L2 and CMM sites in these examples have been recorded simultaneously. The gray bars indicate call occurrences. A, High-pass-filtered raw recordings (gray lines) are rectified and decimated to yield an AMUA signal (black lines) with a sampling period of 2.5 ms, which reflects the strength of local action potential activity. This signal has been used for most analyses in this study; in some analysis, an AMUA activity threshold was used (see Materials and Methods; here indicated with a dashed line). Shown are two consecutive response epochs, with time relative to the start of the first call in the example, not relative to the start of the call series. The inset shows two action potentials from the CMM signal. B, Raster plots of a random 200 call epochs sorted on presentation order from top to bottom. Note that between-epoch response patterns are stereotypic in L2, and more variable in CMM. The dynamic range of these and other raster plots in this paper has been clipped for visual presentation only. C, Responses during call epochs and silent control epochs (in which no calls were played). Raster plots are sorted on response strength from top to bottom. The call epochs are from the same events as in B, but the sorting order is different. Note that approximately the lower third of the call epochs do not contain any response activity at the CMM sites, whereas the L2 site always shows response activity. Also note that control epochs may contain spontaneous activity. D, Probability density plot of response strengths of call epochs and silent control epochs at the L2 and CMM sites of B and C (n = 200 epochs). In the L2 example, the curves do not overlap, which indicates that this site always responded to call stimulation. In the CMM example, there is a considerable overlap (0.48; the area under each curve is 1.0), which is caused by the site not always responding, as well as by spontaneous activity during silent control epochs.
Figure 3.
Figure 3.
Locations of the multielectrode array in the auditory forebrain; this figure can be used as a map to identify the location of individual sites within auditory brain regions. Electrode sites are located at the center of the colored pixels in the 4 × 8 image matrix and are referred to throughout the text by a tuple of two numbers, (i,j), where i indicates the shank number and j, the site position on the shank. Colors represent the mean level of stereotypy, calculated over the different call stimuli that have been presented to each subject. Highly stereotypic responses are associated with the primary auditory area L2, while nonstereotypic responses are associated with secondary auditory areas NCM and CMM. For every individual, distance of the multielectrode to the interhemispheric plane is indicated, and the order of sections is organized from lateral (top left) to medial (bottom right). The location of the multielectrode in bird 3 could not be anatomically verified, and distance is based on stereotaxic coordinates. The interhemispheric and multielectrode planes are approximately, but not fully, in parallel. Distances to the midline have been estimated for the center of the array; the location of individual sites may thus deviate somewhat from this estimate in the medial–lateral direction. The white dots at pixel centers indicate that the corresponding site had DPC values >0.25 for both call stimuli in at least one switching-oddball series. Orientation of the parasagittal sections is as follows: top, dorsal; bottom, ventral; left, caudal; right, rostral. The black outline caudodorsally indicates the border of nidopallium and mesopallium, not the brain surface. The solid gray lines indicate the border of L2; the dashed gray lines indicate that the border of L2 is indistinct. Hp, Hippocampus; NCM, caudomedial nidopallium; CMM, caudomedial mesopallium; L2, subdivision of field L that includes L, L2a, and L2b (between which we do not distinguish in the current study); LaM, lamina mesopallialis (Fortune and Margoliash, 1992; Vates et al., 1996). Note that the distance between the shanks in some multielectrodes may be either 400 or 200 μm.
Figure 4.
Figure 4.
Examples of response strengths to individual call events in one switching-oddball series in bird 9. A, B, A site in L2, site (2,6) (A), and a site in CMM, site (3,3) (B). Sites have been recorded simultaneously. Every dot represents a stimulus presentation (event). Note that the histograms are normalized per condition (standard/deviant), which differ in the number of occurrences. The double-peak distributions in B are caused by the occurrence of nonresponses (lower peak) (i.e., “response” epochs that contain no AMUA activity above background level) (see Results, Secondary auditory sites do not always respond to all call recurrences).
Figure 5.
Figure 5.
Relationship between deviant preference values, DPC, of the two call stimuli within the same switching-oddball series for primary auditory sites (L2) and secondary auditory sites (CMM and NCM). Each dot represents the values of a call pair at a given site.
Figure 6.
Figure 6.
Examples of raster plots of AMUA activity at secondary auditory sites for standard and deviant conditions. Each raster represents one call stimulus within one switching-oddball series, where standard events (top; n = 100) and deviant events (bottom; n = 100) are vertically separated by a black line. Standard events were selected randomly (25 from 225 events per block). Deviant events are all represented (25 events per block). The numbers in the top right corner of each raster plot indicates the deviant preference value, DPC, for that particular call and site. A, Activity of two call stimuli, N and M, of one switching-oddball series recorded at three different sites simultaneously. Note that responses are biased to deviant events at all three sites. The same is true for the 11 other simultaneously recorded secondary sites in this animal (see text for DPC values). Site (3,3) is the same site as shown in Figure 4B. B, Activity to call stimuli of three other switching-oddball series in the same animal, at site (3,3). Responses at this site are biased to deviant events, regardless of the call stimulus. C, Examples from six other birds: bird 1, site (3,5); bird 3, site (4,3); bird 6, site (1,1); bird 7, site (1,8); bird 10, site (2,8); bird 12, site (4,1).
Figure 7.
Figure 7.
Responses of secondary auditory sites to deviant events are dependent on call event history beyond the immediately preceding call. For every recorded stimulus, call events were categorized according to the recency of the last deviant, between 625 and 6250 ms ago. As the call onset to next call onset interval was always 625 ms, recency 625 ms corresponds to those call events that were immediately preceded by a deviant, and recency 6250 ms are those for which the last deviant was 10 call events ago. Z-scores were calculated from the response strengths (mean of all secondary sites) to call events (n = 2000) within call series. The mean z-score (n = 106) and its SE are shown here per recency category and probability. D, Deviant; S, standard.
Figure 8.
Figure 8.
Examples of secondary auditory sites that do not always respond to call events. Each raster plot represents response epochs from one site; the top half are all 100 deviant events; the bottom half are the 100 epochs (of all 1000) with the weakest response strengths at the secondary site (first column). The second column shows the simultaneously recorded responses at a primary site, if available. Note that the 100 weakest epochs in the first column lack any response activity, while primary sites always respond. Bird 1: sites (3,8), (2,5); bird 2: (2,2), (4,3); bird 3: (2,4); bird 4: (1,8), (4,6); bird 5: (2,8); bird 6: (1,4); bird 7: (2,2); bird 8: (3,1), (3,2); bird 9: (2,2), (3,8); bird 10: (1,1); bird 11: (1,1), (4,4); bird 12: (4,1), (2,5). The L2 site of bird 1, (2,5), is situated on the border with NCM and has for most call stimuli a low stereotypy value (Fig. 3). The call shown here is an exception (stereotypy, 0.73), so that we classify it as a L2 response.
Figure 9.
Figure 9.
Internal synchrony in response patterns across different secondary auditory sites in NCM. A, Raster plot of activity at two sites during a random 20 (of 1000) call epochs (call Q; bird 10). The numbers at the rows refer to the sequence number of the call event in the switching-oddball series. Activity patterns are similar between the two sites, which are 566 μm apart. B, Same epochs of site (2,2) as in A, but now sorted on the latency of the strongest peak within an epoch. Nonresponses (red bar) are considered to have no latency and are appended after the epoch with the longest latency. C, The raster plot of all 1000 call Q epochs at site (2,2) is sorted on the latency of the strongest peak within an epoch, and the raster plots of the 13 other sites are ordered correspondingly, so that concurrent epochs are aligned vertically with that of (2,2). The peak of activity at (2,2) is matched by synchronous activity at other sites, even though it is not locked to the call stimulus. At a number of sites, response traces can be seen that are synchronized to the call stimulus, but these are faint and presumably originate from nearby primary sites in L2. The local density of deviants in the sorted raster is indicated by a color bar and has been calculated with a histogram using a bin width of call 50 epochs. Site (2,2) has a DPC value of 0.30 for call Q and 0.26 for call R and is thus strongly sensitive to call deviance. D, Nonresponses occur throughout the switching-oddball series and are followed by responses. Note that only nonresponses at call Q are indicated; the other call in the series (call R) is not shown. E, Raw action potential waveforms around one peak at the different sites. The distances indicated are relative to site (2,2). F, The nonlinear shape of the peak activity bursts in the call stimulus-triggered, latency-sorted rasters indicate that the underlying process that generates this activity is linked to call perception. If activity were randomly timed with respect to call occurrence it would show a linear shape. This is illustrated here by superposing a semitransparent version of the call triggered activity raster of site (2,2) in C (in gray tones) on an activity raster of the same activity but then randomly triggered (in green tones; random uniform distribution, for each event between 0 and 625 ms after call occurrence). G, The latency of the peak activity bursts differs depending on whether or not a call stimulus is deviant. Note that the time axis of the two rasters ranges from 0 to 150 ms after call onset for visual purposes but that quantification of peak latency was based on the complete response epoch duration of 625 ms. The bottom plot shows the latency of the peak activity (i.e., maximum AMUA within an epoch) extracted from the top rasters, a procedure that was used to statistically test for differences in latency between standard and deviant conditions across all birds in this study, the outcome of which is highly significant (see Results, Responses of secondary auditory sites are internally synchronized).
Figure 10.
Figure 10.
A, Additional examples of synchronous activity between secondary auditory sites that are separated by large distances. For each bird, raster plots are sorted from top to bottom on the latency of the strongest peak in the AMUA signal of the site in the top row. The events in the raster plots of the sites in the bottom row are aligned to those of the raster plot in the top row. Note that the pattern of peak activity in the top row often matches to activity at the site in the bottom row, and that nonresponses in the top row correspond to nonresponses in the bottom row. Also note that deviant events, the density of which is indicated by the color bar on the right side of raster plots, tend to have lower peak latencies (i.e., occur more frequently toward the top of the raster plot). B, Image plots of mean IS indices for all sites in this study. Each colored pixel represents the mean of the IS of that site (for anatomical location of sites, see Fig. 3) with a selection of other sites. Each row of image plots corresponds to a different kind of selection. In the top row (ISB), the mean is calculated over the four highest IS values; in the middle row (ISD), it is calculated over the 16 highest IS values; in the bottom row (ISL), it is calculated over the 4 highest IS values between the focal site and sites that are at least separated by 600 μm from the focal site. Gray pixels are sites that either were generally unresponsive or did not have sufficient concurrent responses with other sites (<5% of epochs). C, Distribution of time lags of maximum normalized cross-covariance between secondary auditory site pairs. Site pairs have been categorized depending on whether or not the distance between them is >600 μm. For most site pairs, cross-covariance is maximal at 0.0 ms.

References

    1. Amin N, Doupe A, Theunissen FE. Development of selectivity for natural sounds in the songbird auditory forebrain. J Neurophysiol. 2007;97:3517–3531. - PubMed
    1. Anderson LA, Christianson GB, Linden JF. Stimulus-specific adaptation occurs in the auditory thalamus. J Neurosci. 2009;29:7359–7363. - PMC - PubMed
    1. Antunes FM, Nelken I, Covey E, Malmierca MS. Stimulus-specific adaptation in the auditory thalamus of the anesthetized rat. PLoS One. 2010;5:e14071. - PMC - PubMed
    1. Baayen R, Davidson D, Bates D. Mixed-effects modeling with crossed random effects for subjects and items. J Mem Lang. 2008;59:390–412.
    1. Beckers GJ, Gahr M. Neural processing of short-term recurrence in songbird vocal communication. PLoS One. 2010;5:e11129. - PMC - PubMed

MeSH terms

LinkOut - more resources