Multicenter Study
. 2012 Aug 1;32(31):10649-61.
doi: 10.1523/JNEUROSCI.0759-12.2012.

Stepwise connectivity of the modal cortex reveals the multimodal organization of the human brain

Affiliations
Multicenter Study

Stepwise connectivity of the modal cortex reveals the multimodal organization of the human brain

Jorge Sepulcre et al. J Neurosci. .

Abstract

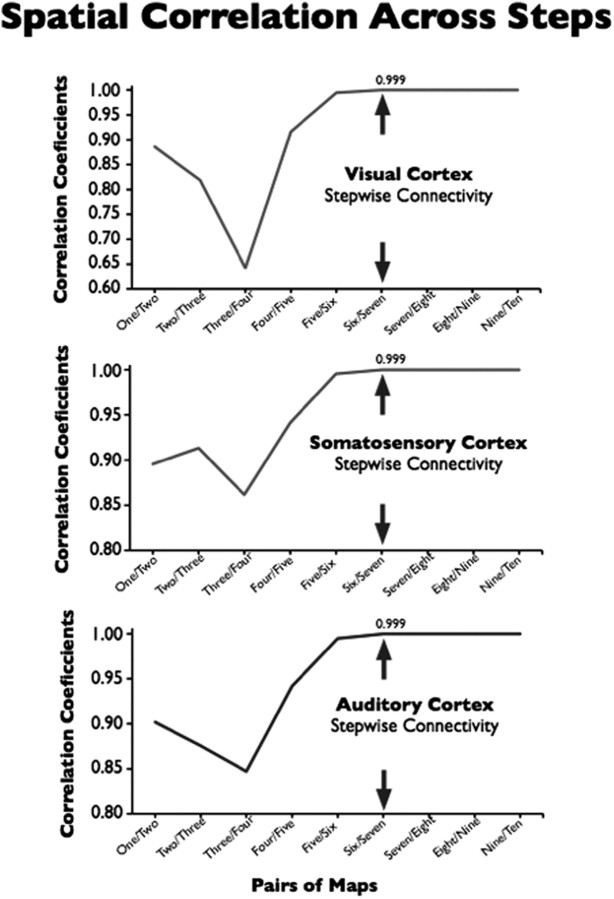
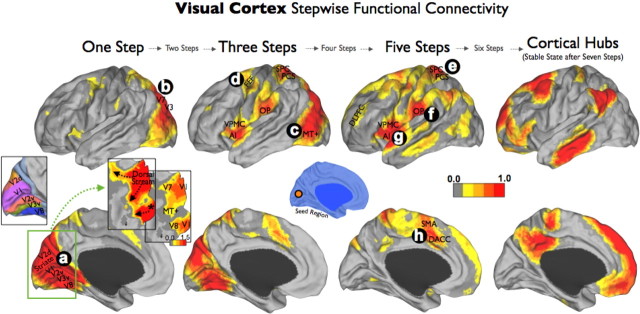
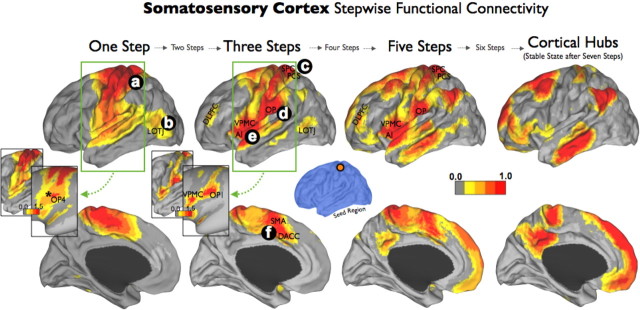
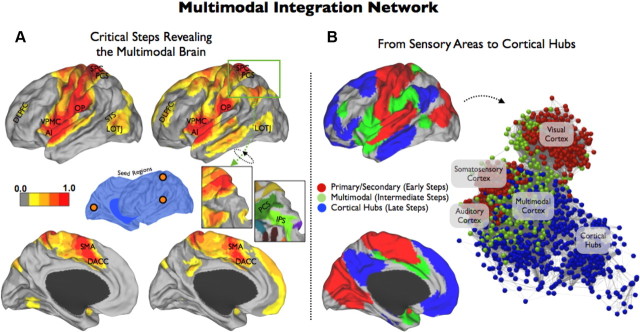
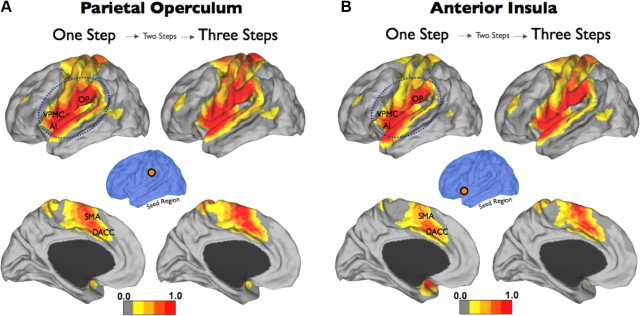
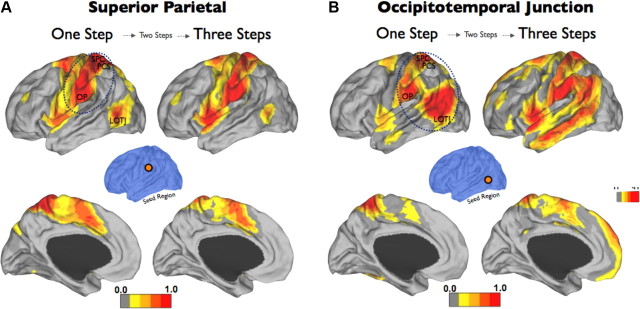
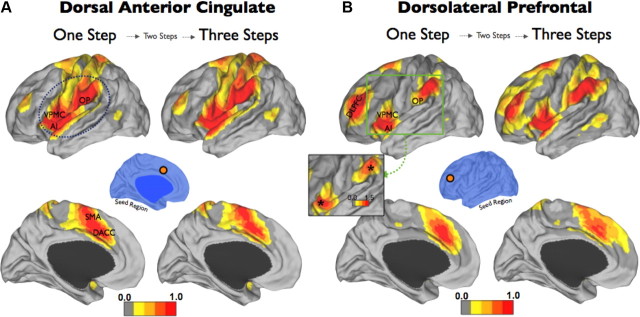
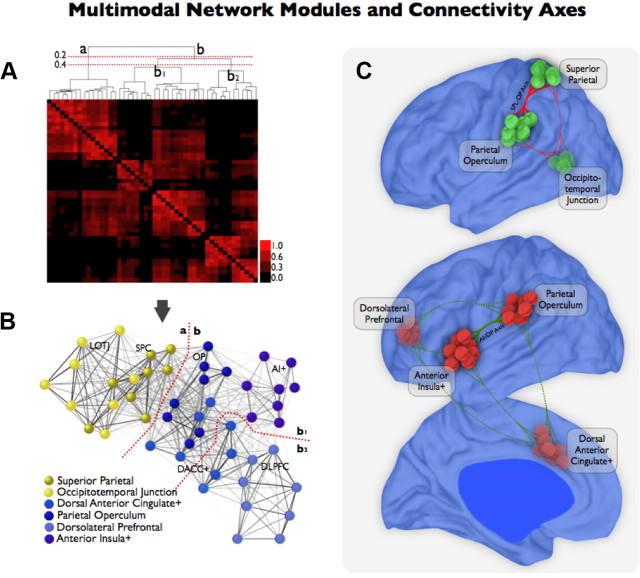
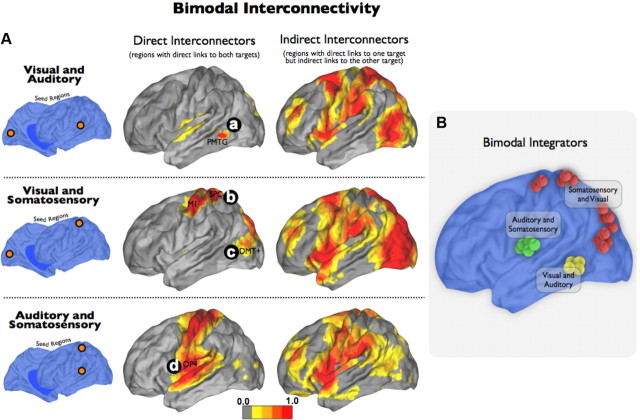
How human beings integrate information from external sources and internal cognition to produce a coherent experience is still not well understood. During the past decades, anatomical, neurophysiological and neuroimaging research in multimodal integration have stood out in the effort to understand the perceptual binding properties of the brain. Areas in the human lateral occipitotemporal, prefrontal, and posterior parietal cortices have been associated with sensory multimodal processing. Even though this, rather patchy, organization of brain regions gives us a glimpse of the perceptual convergence, the articulation of the flow of information from modality-related to the more parallel cognitive processing systems remains elusive. Using a method called stepwise functional connectivity analysis, the present study analyzes the functional connectome and transitions from primary sensory cortices to higher-order brain systems. We identify the large-scale multimodal integration network and essential connectivity axes for perceptual integration in the human brain.


Figures

Figure 1.
Figure 1.
Stepwise functional connectivity analysis for identifying the brain connectome of modal cortex. A, The functional connectivity map of the posterior cingulate cortex is computed using a conventional seed-based approach, which is displayed on a cortical surface and as a network graph (star-net topology). Only one link-step connection is computed in this approach. B, On the other hand, SFC analysis takes full advantage of the whole connectivity association matrix of the individual brains to analyze the functional connectivity of seed regions using a wide range of link-step distances. C illustrates SFC analysis in detail. From any node (j; red nodes) in the brain, we compute the number of pathways (Djil) that connect to a voxel in an a priori seed node (i; blue node) with a particular number of links l (where l is the specific link-step distance). Similar to the conventional seed-based approach, in the one-link-step distance case, only direct connections to the seed are considered (small arrows in C-a). In higher-order step distances, we explore connectivity patterns beyond direct connections, subsequently expanding to the rest of the brain (C-b, C-c). Note that for schematic purposes only, one seed voxel node (blue color) is displayed in C-a, C-b, and C-c.
Figure 2.
Figure 2.
Spatial correlation across steps. Voxel-level spatial correlations between consecutive pairs of SFC maps were calculated for each sensory modality to check the topological stability of our results. The results showed stable correlation coefficients after a six to seven link-step distance (arrows). Therefore, the range from one to seven steps was considered sufficient for the characterization of the connectivity patterns.
Figure 3.
Figure 3.
Visual cortex stepwise functional connectivity. Visual cortex SFC analysis revealed that visual cortex's direct connectivity follows three different pathways, two dorsal (ac) and one ventromedial (a; inset, star). In addition to the conventional cortical surface and to avoid a ceiling visualization effect in the degree of connectivity of early visual regions, two flat projections centered on the occipital lobe (green square) are presented using the same (top inset) and a relaxed color-scale threshold (bottom inset). In subsequent steps, the visual cortex connectivity reached the frontal eye field (d), the multimodal network (eh), and finally, the cortical hubs of the human brain. The visuotopic map was provided by Caret software (Van Essen and Dierker, 2007). Visuotopic areas: V1, V2, V3, V7, V8, and MT+; PCS, posterior central sulcus; SMA, supplementary motor area.
Figure 4.
Figure 4.
Somatosensory cortex stepwise functional connectivity. Somatosensory cortex SFC analysis showed dense connections within the entire somatomotor cortex, strong direct connectivity with the secondary somatosensory area SII in OP4 (a; inset, star) and, to a lesser extent, to the LOTJ (b). To better visualize the degree of connectivity, conventional (bottom insets) and inflated projections (top insets) of the results using a relaxed color-scale threshold and centered on the insula region/postcentral gyrus (green square) are presented in the one-step and three-step maps. Primary somatosensory cortex had later connectivity to the multimodal network (cf) and to the cortical hubs. PCS, Posterior central sulcus, SMA, supplementary motor area.
Figure 5.
Figure 5.
Auditory cortex stepwise functional connectivity. Auditory cortex SFC analysis showed dense connections within the local auditory-related regions, strong direct connectivity with OP4 (a; inset, star) and, to a lesser extent, to the LOTJ (b). To better visualize the degree of connectivity, conventional (bottom inset) and inflated projections (top inset) of the results using a relaxed color-scale threshold and centered on the insula region (green square) are presented in the one-step and three-step maps. In the subsequent steps, auditory connectivity reached the multimodal network (cf) and the cortical hubs. PCS, Posterior central sulcus; SMA, supplementary motor area.
Figure 6.
Figure 6.
Multimodal integration network. An SFC analysis combining the three sensory seeds simultaneously showed the complete map of the multimodal integration network of the human brain. A presents the three- and five-step maps of the combined SFC analysis. B presents the initial (binarized average of the one-step and two-step maps), intermediate (binarized average of the three- to five-step maps), and terminal (binarized average of the six- and seven-step maps) cores. It is noteworthy that the multimodal integration network (green cortex and nodes) acts as a strong network interface between the unimodal-related systems (red cortex and nodes) and the cortical hubs core (blue cortex and nodes). The sulcal map was provided by Caret software (Van Essen and Dierker, 2007). PCS, Posterior central sulcus; SMA, supplementary motor area.
Figure 7.
Figure 7.
Multimodal integration network in the left and right hemispheres. We compared the left and right hemispheres to check for brain asymmetries in the multimodal integration network. Sensory cortices of the right hemisphere have connectivity to a wider multimodal region in the temporoparietal junction than the left hemisphere (a and b). On the other hand, with a higher number of steps, only primary sensory cortices of the left hemisphere have connectivity to VLPFC and part of the Broca's language area (b). STG, Superior temporal gyrus; VLPFC, ventrolateral prefrontal cortex.
Figure 8.
Figure 8.
Characterization of the multimodal integration network: parietal operculum and anterior insula. A, B, Parietal operculum and anterior insula+ regions showed strong direct connectivity between them (one-step maps). In both cases, the other region represented the highest degree of connectivity in their respective maps. In intermediate steps, they are connected to the rest of the multimodal network (three-step maps). SMA, Supplementary motor area.
Figure 9.
Figure 9.
Characterization of the multimodal integration network: superior parietal cortex and lateral occipitotemporal junction. A, The superior parietal region of the multimodal network displayed direct connections mostly to the parietal operculum, but also to the frontal eye field, lateral occipitotemporal junction, dorsal anterior cingulate+, and anterior insula+ (one-step map). In later stepwise conditions, a superior parietal connectivity pattern was concentrated in the parietal operculum and anterior insula+ core (three-step map). B, The connectivity of the lateral occipitotemporal junction of the multimodal network diffused locally in a wide area at the temporal–parietal–occipital lobe confluence and also had dense connectivity to superior parietal cortex and parietal operculum multimodal regions (one-step map). Later, the connectivity converged within the parietal operculum and anterior insula+ core (three-step map). PCS, Posterior central sulcus.
Figure 10.
Figure 10.
Characterization of the multimodal integration network: dorsal anterior cingulate cortex and dorsolateral prefrontal cortex. A, The dorsal anterior cingulate+ multimodal region was densely connected to the parietal operculum and anterior insula+ in both direct and indirect manners (one- and three-step maps). B, The multimodal dorsolateral prefrontal cortex region is connected in one-step distance to the anterior part of the anterior insula+ region and to the posterior part of the parietal operculum (one-step map). Subsequently, dorsolateral prefrontal cortex showed connectivity to the rest of multimodal network regions (three-step map). SMA, Supplementary motor area.
Figure 11.
Figure 11.
Modules and connectivity axes of the multimodal integration network. A, B, The average-linkage hierarchical clustering analysis of the multimodal integration network (A) confirmed two main set of regions: (1) module a, formed by superior parietal cortex (dark yellow) and lateral occipitotemporal junction (light yellow), and (2) module b, formed by the parietal operculum (dark blue), anterior insula+ (violet), dorsal anterior cingulate+ (blue), and dorsolateral prefrontal cortex (light blue; B). The dendrogram shows, at a cutoff criterion of r > 0.2, the main partition in a and b modules but also a meaningful subdivision within module b at cutoff criterion r > 0.4. Submodule b1 is formed by parietal operculum (dark blue), anterior insula+ (violet), and part of dorsal anterior cingulate+ (blue), and submodule b2 is formed by dorsolateral prefrontal cortex (light blue) and part of dorsal anterior cingulate+ (blue). C, These results pointed out the existence of major cores and functional connectivity axes within the multimodal integration network. For instance, the superior parietal cortex–parietal operculum connectivity axis was important for the communication between modules a and b. The parietal operculum, anterior insula+, and part of the dorsal anterior cingulate nodes formed a central core in the overall organization of the multimodal network.
Figure 12.
Figure 12.
Bimodal interconnectors between visual, somatosensory, and auditory cortices. A, B, Bimodal integration regions in the human brain were described between visual and auditory (a), visual and somatosensory (b, c) and auditory and somatosensory (d) modalities. PMTG, Posterior middle temporal gyrus; DMT+, dorsal MT+.

Comment in

References

    1. Amunts K, Malikovic A, Mohlberg H, Schormann T, Zilles K. Brodmann's areas 17 and 18 brought into stereotaxic space-where and how variable? Neuroimage. 2000;11:66–84. - PubMed
    1. Beauchamp MS. See me, hear me, touch me: multisensory integration in lateral occipital-temporal cortex. Curr Opin Neurobiol. 2005;15:145–153. - PubMed
    1. Beauchamp MS, Argall BD, Bodurka J, Duyn JH, Martin A. Unraveling multisensory integration: patchy organization within human STS multisensory cortex. Nat Neurosci. 2004;7:1190–1192. - PubMed
    1. Benjamini Y, Hochberg Y. Controlling the false discovery rate: a practical and powerful approach to multiple testing. J R Statist Soc. 1995;57:289–300.
    1. Biswal B, Yetkin FZ, Haughton VM, Hyde JS. Functional connectivity in the motor cortex of resting human brain using echo-planar MRI. Magn Reson Med. 1995;34:537–541. - PubMed

Publication types

LinkOut - more resources