. 2012 Aug 1;32(31):10699-712.
doi: 10.1523/JNEUROSCI.0372-12.2012.

Purinergic modulation of neuronal activity in developing auditory brainstem

Affiliations

Purinergic modulation of neuronal activity in developing auditory brainstem

Beatrice Dietz et al. J Neurosci. .

Abstract

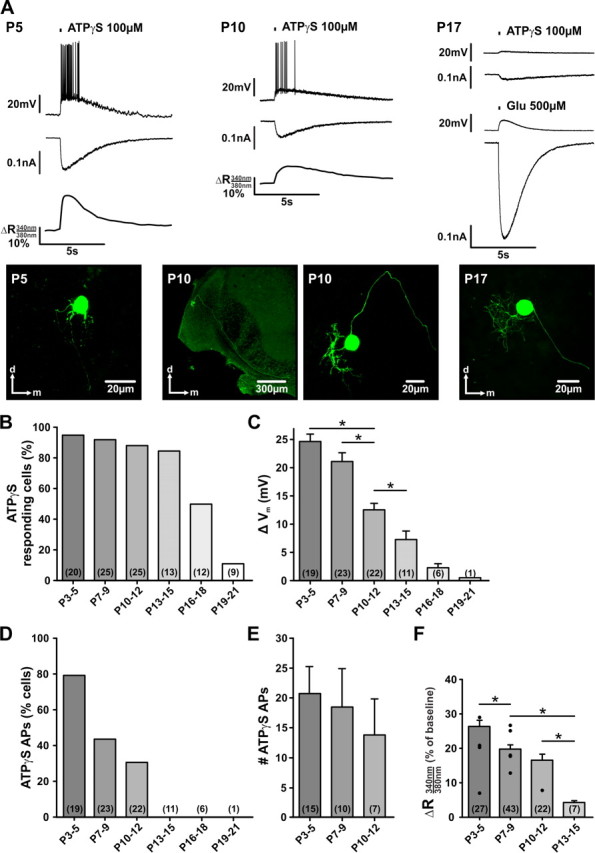
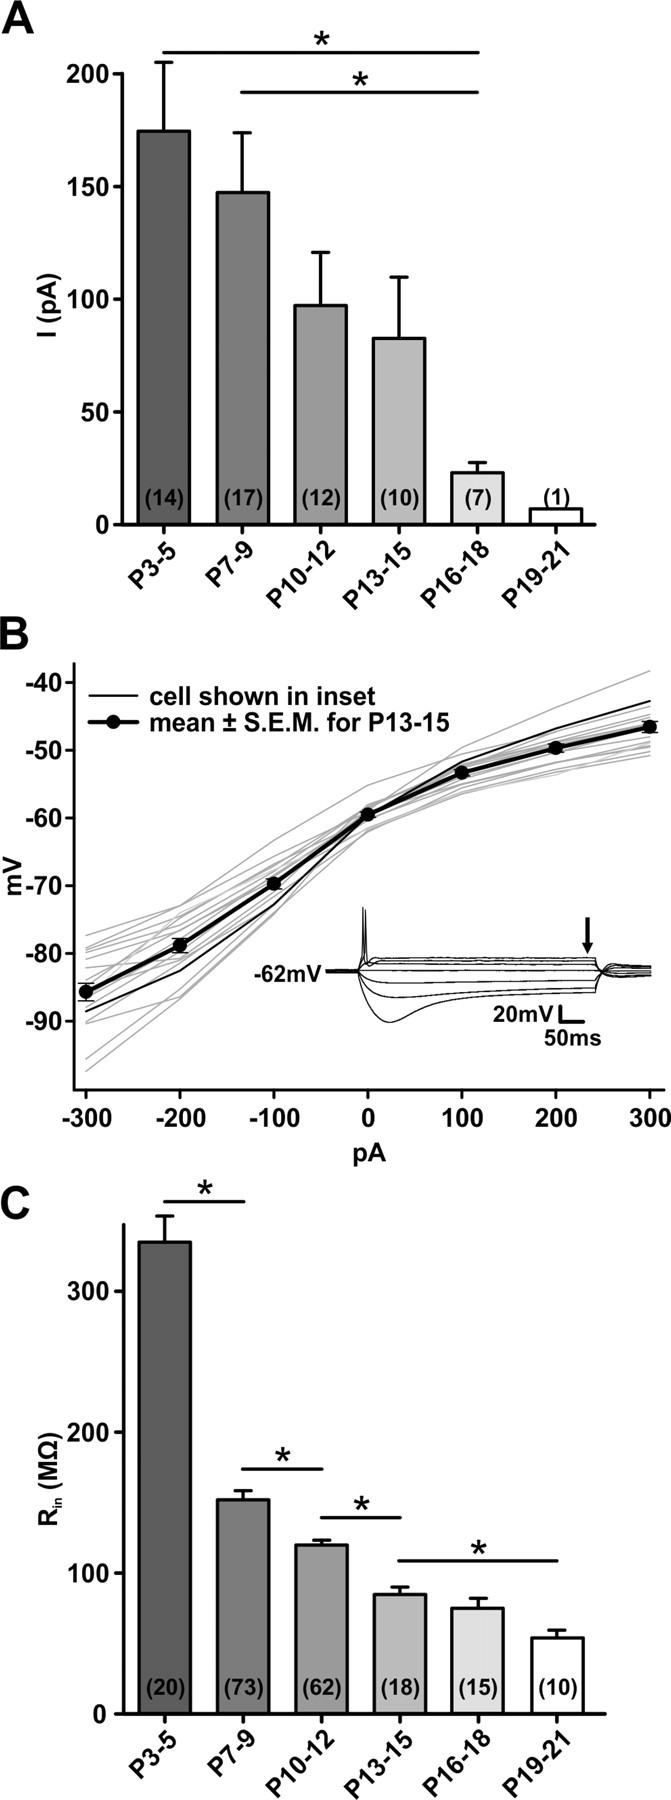
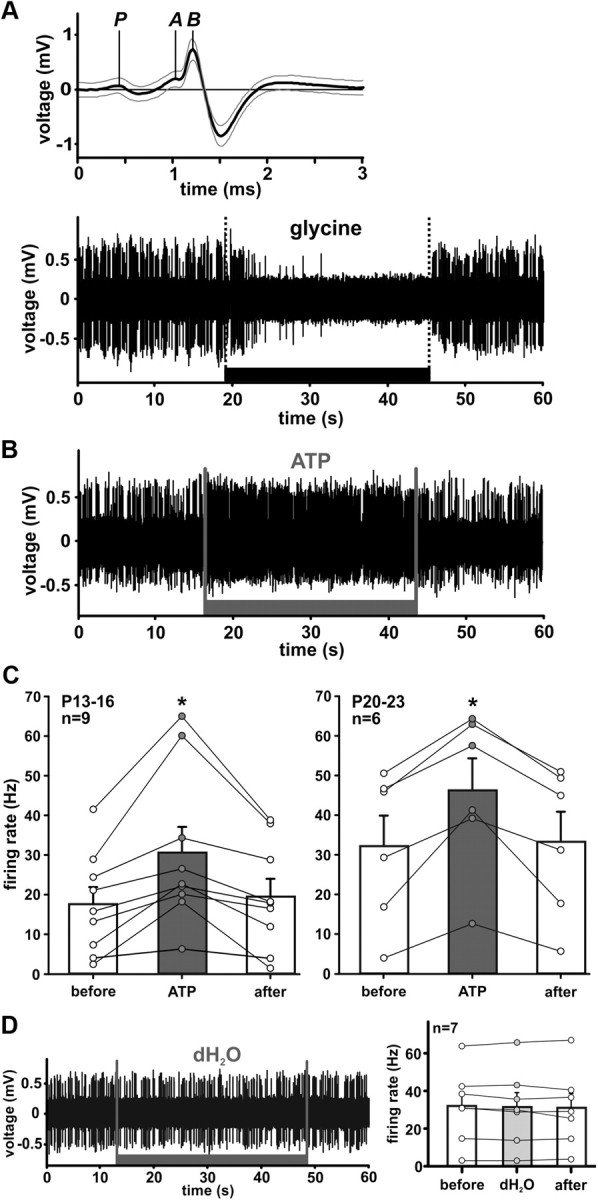
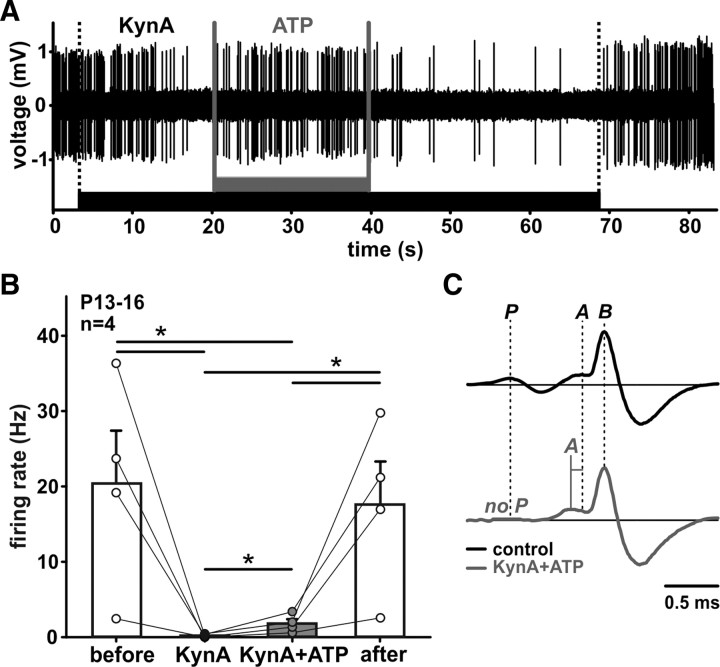
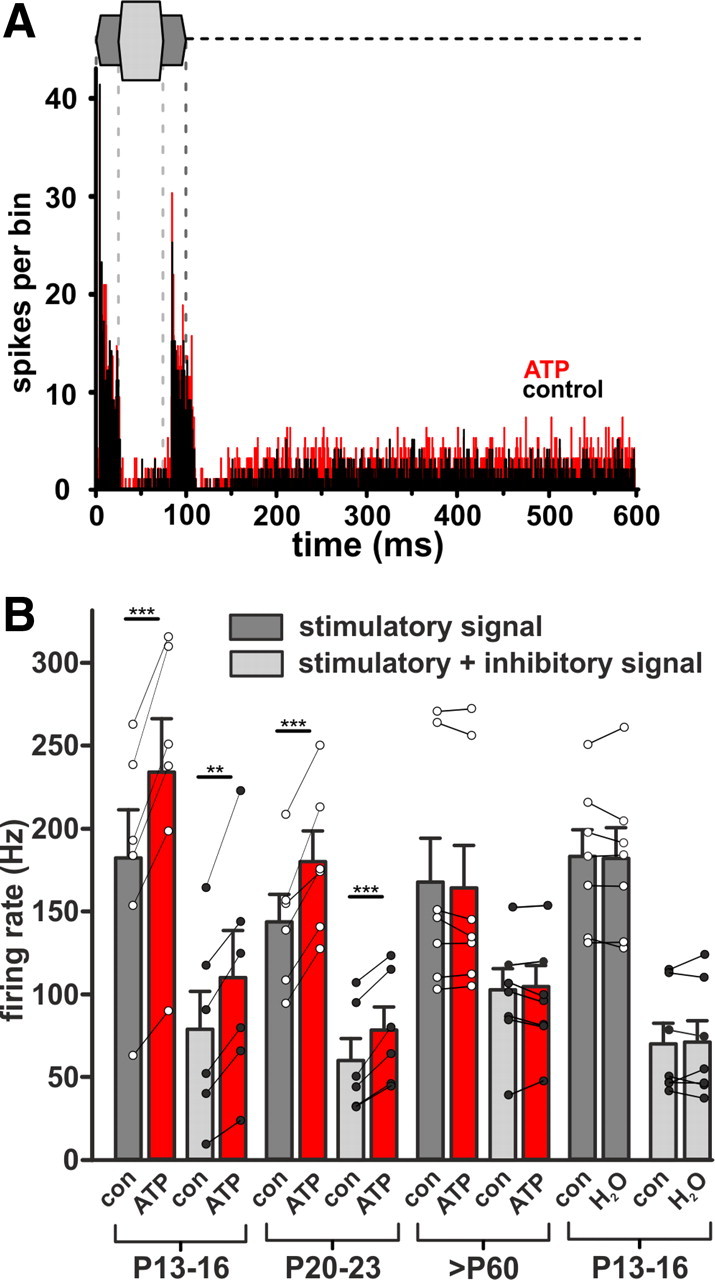
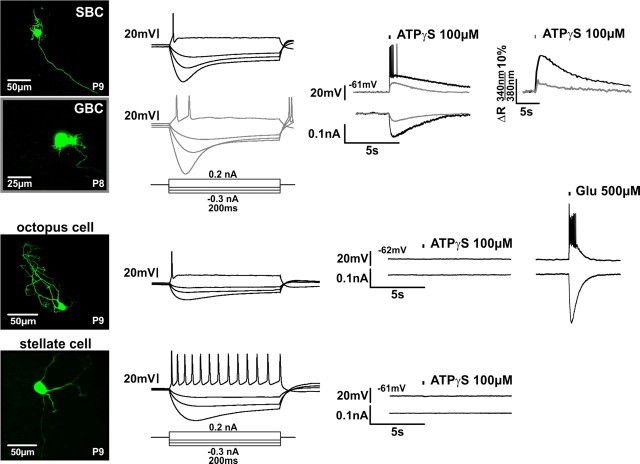
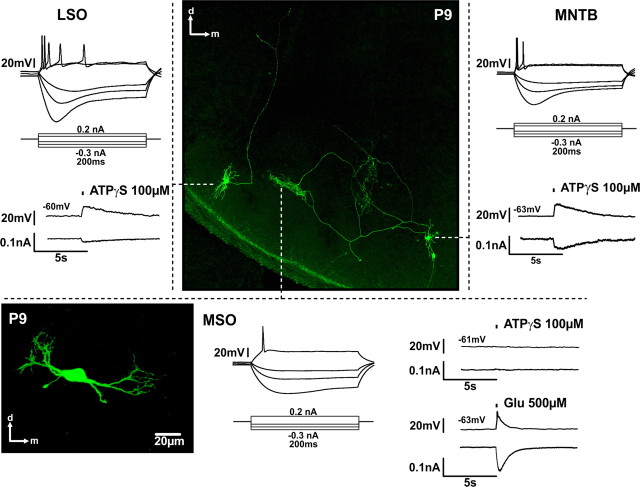
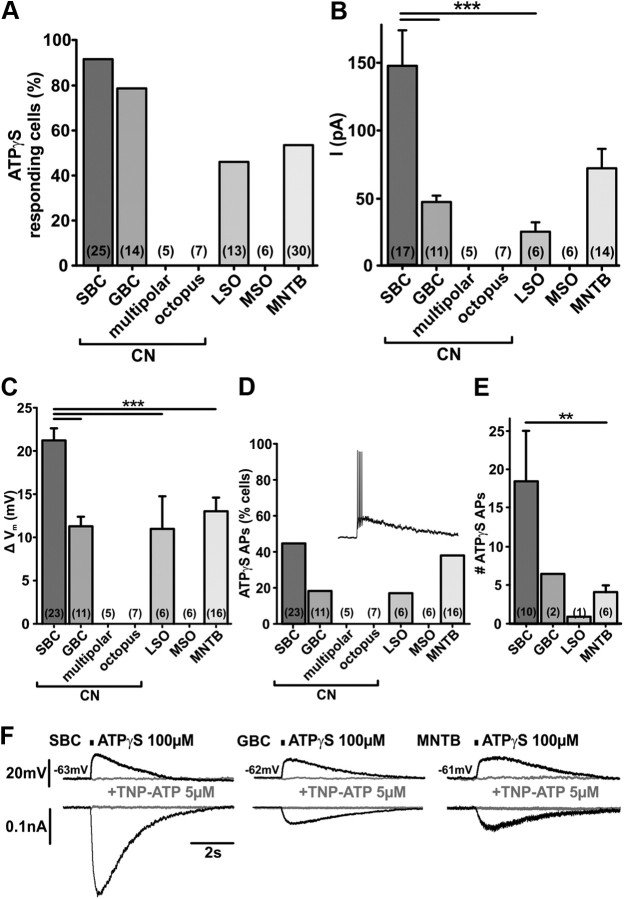
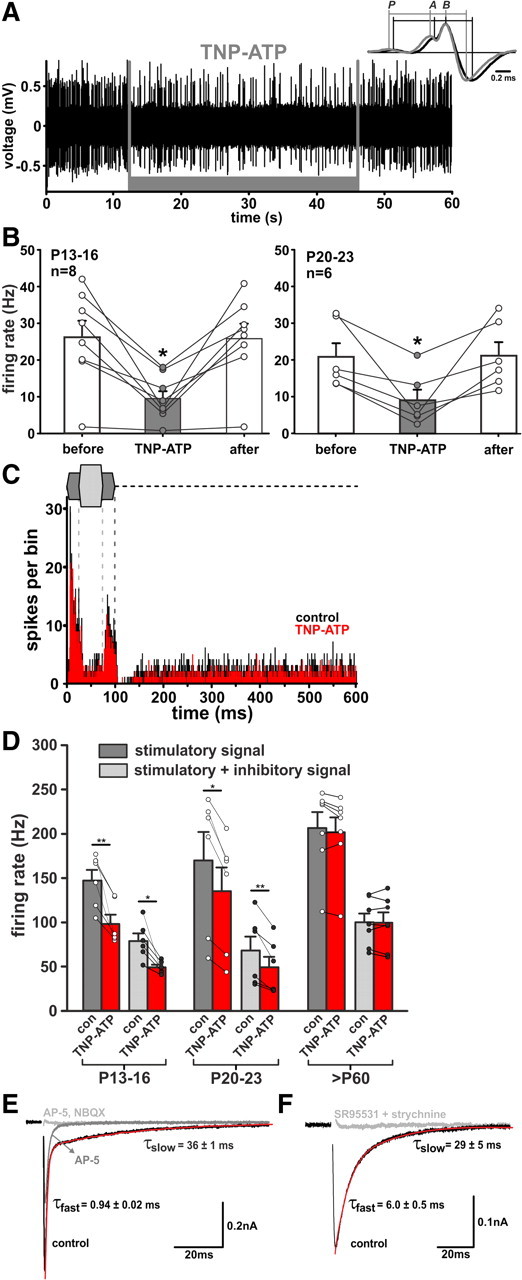
In the developing nervous system, spontaneous neuronal activity arises independently of experience or any environmental input. This activity may play a major role in axonal pathfinding, refinement of topographic maps, dendritic morphogenesis, and the segregation of axonal terminal arbors. In the auditory system, endogenously released ATP in the cochlea activates inner hair cells to trigger bursts of action potentials (APs), which are transferred to the central auditory system. Here we show the modulatory role of purinergic signaling beyond the cochlea, i.e., the developmentally regulated and cell-type-specific depolarizing effects on auditory brainstem neurons of Mongolian gerbil. We assessed the effects of P2X receptors (P2XRs) on neuronal excitability from prehearing to early stages of auditory signal processing. Our results demonstrate that in neurons expressing P2XRs, extracellular ATP can evoke APs in sync with Ca(2+) signals. In cochlear nucleus (CN) bushy cells, ATP increases spontaneous and also acoustically evoked activity in vivo, but these effects diminish with maturity. Moreover, ATP not only augmented glutamate-driven firing, but it also evoked APs in the absence of glutamatergic transmission. In vivo recordings also revealed that endogenously released ATP in the CN contributes to neuronal firing activity by facilitating AP generation and prolonging AP duration. Given the enhancing effect of ATP on AP firing and confinement of P2XRs to certain auditory brainstem nuclei, and to distinct neurons within these nuclei, it is conceivable that purinergic signaling plays a specific role in the development of neuronal brainstem circuits.


Figures

Figure 1.
Figure 1.
Developmental profile of P2X-mediated responses in SBCs. A, Exemplary whole-cell recordings from SBCs at different developmental stages (P5, P10 prehearing, and P17 after hearing onset). ATPγS was applied through the puff-pipette (150 ms, 2 psi, 20 μm to cell soma). Ca2+ measurements were done simultaneously with current-clamp recordings (Vh = −60 mV). All traces originate from the respective biocytin-labeled neurons shown below. The P10 neuron is shown in two magnifications to visualize the course of the axon passing along the ventral acoustic stria (left) and the morphology of the dendritic tree (right). The morphology of recorded cells characterizes them as SBCs. Note that the ATPγS-induced responses are downregulated during development. In P17 SBC, additional application of glutamate was done to confirm cells' vitality. B, Percentages of neurons responding to ATPγS. C, Mean membrane potential changes elicited by ATPγS. D, Percentages of neurons generating APs in response to ATPγS. E, Number of APs in the SBCs shown in D. ANOVA yielded no difference between the groups. F, Changes in fluorescence ratios indicating calcium responses to ATPγS. Black circles show values obtained in simultaneous whole-cell-Ca2+ imaging experiments from morphologically characterized SBCs. The remaining data are from SBCs in bulk-labeled slices. Data shown in bars are pooled from both approaches. Data in B and D are percentage; C, E, and F depict mean ± SEM. C, F, *p < 0.05, ANOVA. Cell numbers are indicated in parentheses.
Figure 2.
Figure 2.
P2XR current decreases with maturity. A, Mean peak currents evoked by ATPγS in SBCs of different postnatal ages. Current amplitudes gradually decrease to P15, after which a marked reduction is observed. B, Plots of voltage as a function of injected current for 18 SBCs from P13–P15. Inset shows responses of the SBC depicted by the thin black line in the graph. The steady-state voltage was determined at the point shown by the arrow and plotted in the graph. The slope of these plots at the resting membrane potential is the input resistance, on average 84.8 ± 3.7 MΩ (n = 18). C, Developmental change of input resistance of SBCs. The most notable change occurs between P3–P5 and P7–P9. Error bars indicate mean ± SEM. Cell numbers are given in parentheses. *p < 0.05.
Figure 3.
Figure 3.
ATP increases spontaneous activity of SBCs in vivo. A, Top, Complex waveform used as a criterion to identify SBCs in the rostral AVCN (Englitz et al., 2009; Typlt et al., 2010). Thick line shows mean waveform for 1767 spikes, thin gray lines ± SD. The representative extracellularly recorded signal is decomposed into its presynaptic (P) and postsynaptic components (A-EPSP, and B-AP). A, Bottom, Exemplary trace of SBC discharges during iontophoretic application of glycine (400 mm, black bar), which causes a complete but reversible inhibition of spontaneous spiking activity. B, Iontophoretic application of ATP (200 mm, gray bar) reversibly increases firing in an SBC. C, Changes in spontaneous spiking elicited by ATP (200 mm) in P13–P16 and P20–P23 gerbils. D, Application of dH2O (vehicle) has no effect on AP firing. Circles are data from individual cells; error bars indicate mean ± SEM. *p < 0.05.
Figure 4.
Figure 4.
In vivo ATP-evoked APs in the absence of glutamatergic transmission. A, Exemplary recording of spontaneous activity of an SBC, before, during, and after application of KynA (200 mm, black bar). Upon the complete cessation of glutamatergic APs, application of ATP (200 mm, gray bar) causes a resumption of AP firing, yet without completely restoring the initial rate. B, AP firing rate under different conditions: (before) spontaneous activity before application averaged for 90 s; (KynA) mean activity of last 3 s before ATP; and (KynA + ATP) ATP application in the presence of KynA, mean activity for the whole duration of application was considered (mean application duration 28.3 ± 4.4s, n = 4) and (after) mean activity for 60 s period after the end of KynA application. Circles are data from individual cells. Error bars indicate mean ± SEM; *p < 0.05, ANOVA on ranks. C, Top, Mean waveform for control condition (black, n = 714). Bottom, Mean waveform during KynA + ATP application (gray, n = 76). Note that the complex waveform of the SBC discharges recorded under the KynA + ATP condition lacks the presynaptic signal component (P). The latter signals also have longer response rise time from the EPSP to the postsynaptic AP (A-B) than APs evoked by synaptic release of glutamate (black trace).
Figure 5.
Figure 5.
ATP increases acoustically evoked activity of SBCs in vivo. A, Exemplary PSTHs (bin width 0.5 ms) of a single unit in response to two-tone stimulation. Sketch above the histogram: dark gray, excitatory stimulus (100 ms, frequency at the unit's CF = 2.3 kHz, 30 dB SPL); light gray, embedded inhibitory stimulus (50 ms, lagging 25 ms after onset of excitatory stimulus, frequency 6.2 kHz, 65 dB SPL); dashed line, spontaneous activity, 100–600 ms. Unit shows a phasic–tonic response pattern; during the tonic phase, response is reduced through inhibition. Black and red histograms: discharge activity during 100 stimulus repetitions before and during ATP application (200 mm), respectively. Note that during application of ATP the firing rate is increased throughout all three stimulus epochs, i.e., excitation, inhibition, and spontaneous. B, Summary of changes elicited by ATP (red bars) during excitatory signals at the unit's CFs (dark gray) and acoustically driven inhibition (light gray). The ATP effects were significant for P13–P16 and P20–P23, but not for >P60. Administration of dH2O did not influence firing under acoustic stimulation. Circles represent individual cells. Error bars indicate mean ± SEM. **p < 0.01, ***p < 0.001.
Figure 6.
Figure 6.
P2XRs are expressed on bushy cells, but not on stellate or octopus cells. Left, Biocytin labeling of recorded neurons reveals the morphology of an SBC and a GBC, an octopus, and a stellate cell (top to bottom). The recordings to the right were acquired from the respective cells. Middle, Electrophysiological characterization shows the phasic firing in response to depolarizing current steps in the SBC, GBC, and in the octopus cell. Stellate cell shows the characteristic tonic firing pattern. Responses of SBC and GBC to hyperpolarizing current steps sag back toward rest due to inward rectification. Right, Comparison of the responses, obtained by whole-cell recordings from SBC (black traces) and GBC (gray traces), upon ATPγS puff application (150 ms). The magnitude of depolarization, current, and the Ca2+ signal is more prominent in SBC than in GBC. In octopus and stellate cells, ATPγS had no effect. Control application of glutamate, however, elicited strong responses, thus confirming the cells' vitality.
Figure 7.
Figure 7.
Regional specificity of P2X-mediated responses in the SOC. Whole-cell recordings from biocytin-labeled P9 neurons in the SOC. The labeling was visualized post hoc with Cy2-conjugated streptavidin. Under current-clamp, neurons show typical phasic responses to depolarizing current steps. Note that moderate responses to ATPγS application (150 ms) were recorded in the LSO and in the MNTB neuron, but not in the MSO neuron, the vitality of which was confirmed with glutamate application. The MSO neuron in the lower left is not from the slice shown in the center, but its respective position in the brain slice is indicated by the tip of the dashed line. The position of this neuron shows a good match with the axonal terminal field of the MNTB neuron on the right side. The current and voltage traces correspond to the adjacent neurons.
Figure 8.
Figure 8.
Comparison of the P2X-mediated responses in different auditory brainstem neurons. A, The percentages of neurons (P7–P9) responding to ATPγS differ between nuclei (current-clamp data). ATPγS elicits significantly larger P2X current (B) and depolarization (C) in SBCs than in the other neurons expressing P2XRs. Bars indicate mean peak current or depolarization. Error bars indicate SEM. Note the similar magnitudes of responses in GBC and the principal MNTB neurons. Cell numbers are given in parentheses. ***p < 0.001, ANOVA followed by Holm–Sidak test. D, Percentages of cells in which ATPγS evoked APs. Inset shows exemplary APs elicited by 100 μm ATPγS in an SBC. Numbers in parentheses indicate the total number of recorded cells. E, The mean number of APs elicited by a single ATPγS application is significantly higher in SBCs than in MNTB principal neurons (**p = 0.009, Mann–Whitney rank sum test). In GBC and LSO neurons, APs were recorded in only 2/11 and 1/6 neurons, respectively. F, ATPγS-evoked responses are completely blocked by a P2X1–3 receptor antagonist TNP-ATP in SBCs, GBCs, and in the principal MNTB neurons. Example traces of current-clamp (top) and voltage-clamp recordings (bottom) upon application of ATPγS (150 ms) (black) and under TNP-ATP (gray).
Figure 9.
Figure 9.
Endogenous ATP contributes to SBCs firing in vivo. A, Iontophoretic application of TNP-ATP (1 mm, gray bar) reversibly reduces the rate of spontaneous SBCs firing. Inset shows the mean waveforms calculated for 1299 APs under control condition (black) and 461 APs under TNP-ATP application (gray). The waveforms are aligned at B, the peak of APs: P, prepotential; A, EPSP. Note the longer A-B transition and shorter AP duration under TNP-ATP. B, Changes in spontaneous spiking elicited by TNP-ATP in P13–P16 and P20–P23 animals. Circles are data from individual cells. Error bars indicate mean ± SEM. *p < 0.05. C, PSTHs (bin width 0.5 ms) of responses to a two-tone stimulation. Design as in Figure 5, excitatory stimulus at CF = 1.4 kHz, 20 dB SPL, inhibitory stimulus at 4.8 kHz, 30 dB SPL; before (black) and during TNP-ATP application (red). D, Summary of the TNP-ATP effects (red bars) on the AP rates under excitatory (dark gray) and combined excitatory and inhibitory (light gray) stimulation. TNP-ATP significantly inhibited firing in P13–P16 and P20–P23. Circles represent individual cells. Error bars indicate mean ± SEM. **p < 0.01, ***p < 0.001. E, EPSCs from a P9 SBC, recorded at 33°C. Traces are average for >5 events recorded under each condition. Decays were best fit with the sum of two exponentials. The exponential fit is superimposed on the EPSC decay (red). The NMDAR (50 μm AP-5) and AMPAR (10 μm NBQX) antagonists completely inhibited the EPSCs, leaving no residual component that could be attributed to P2XR activation. F, Example IPSC traces showing mean for >5 single-shock stimuli, recorded from a P9 SBC. IPSCs were recorded at Vhold = −60 mV with [Cl]pipette = 26 mm. Decays were best fit by a double exponential function (red). Pharmacological blockade confirms glycinergic/GABAergic transmission and excludes contribution of P2XRs.

References

    1. Appler JM, Goodrich LV. Connecting the ear to the brain: molecular mechanisms of auditory circuit assembly. Prog Neurobiol. 2011;93:488–508. - PMC - PubMed
    1. Balakrishnan V, Becker M, Löhrke S, Nothwang HG, Güresir E, Friauf E. Expression and function of chloride transporters during development of inhibitory neurotransmission in the auditory brainstem. J Neurosci. 2003;23:4134–4145. - PMC - PubMed
    1. Banks MI, Smith PH. Intracellular recordings from neurobiotin-labeled cells in brain slices of the rat medial nucleus of the trapezoid body. J Neurosci. 1992;12:2819–2837. - PMC - PubMed
    1. Bazwinsky I, Härtig W, Rübsamen R. Characterization of cochlear nucleus principal cells of Meriones unguiculatus and Monodelphis domestica by use of calcium-binding protein immunolabeling. J Chem Neuroanat. 2008;35:158–174. - PubMed
    1. Bischofberger J, Engel D, Li L, Geiger JR, Jonas P. Patch-clamp recording from mossy fiber terminals in hippocampal slices. Nat Protoc. 2006;1:2075–2081. - PubMed

Publication types

MeSH terms

Substances

LinkOut - more resources