

Contributions of mRNA abundance, ribosome loading, and post- or peri-translational effects to temporal repression of C. elegans heterochronic miRNA targets
- PMID: 22855835
- PMCID: PMC3514671
- DOI: 10.1101/gr.136515.111
Contributions of mRNA abundance, ribosome loading, and post- or peri-translational effects to temporal repression of C. elegans heterochronic miRNA targets
Abstract
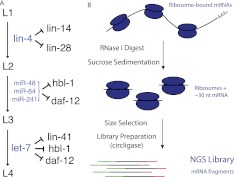
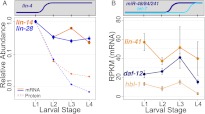
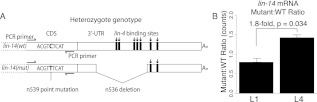
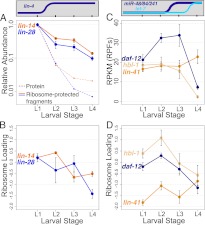
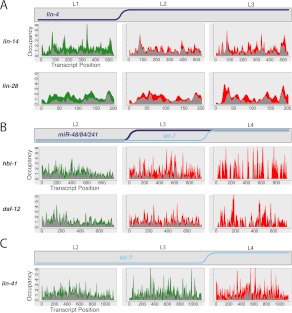
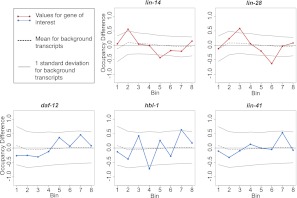
miRNAs are post-transcriptional regulators of gene activity that reduce protein accumulation from target mRNAs. Elucidating precise molecular effects that animal miRNAs have on target transcripts has proven complex, with varied evidence indicating that miRNA regulation may produce different molecular outcomes in different species, systems, and/or physiological conditions. Here we use high-throughput ribosome profiling to analyze detailed translational parameters for five well-studied targets of miRNAs that regulate C. elegans developmental timing. For two targets of the miRNA lin-4 (lin-14 and lin-28), functional down-regulation was associated with decreases in both overall mRNA abundance and ribosome loading; however, these changes were of substantially smaller magnitude than corresponding changes observed in protein abundance. For three functional targets of the let-7 miRNA family for which down-regulation is critical in temporal progression of the animal (daf-12, hbl-1, and lin-41), we observed only modest changes in mRNA abundance and ribosome loading. lin-41 provides a striking example in that populations of ribosome-protected fragments from this gene remained essentially unchanged during the L3-L4 time interval when lin-41 activity is substantially down-regulated by let-7. Spectra of ribosomal positions were also examined for the five lin-4 and let-7 target mRNAs as a function of developmental time, with no indication of miRNA-induced ribosomal drop-off or significant pauses in translation. These data are consistent with models in which physiological regulation by this set of C. elegans miRNAs derives from combinatorial effects including suppressed recruitment/activation of translational machinery, compromised stability of target messages, and post- or peri-translational effects on lifetimes of polypeptide products.
Figures
Similar articles
-
Caenorhabditis elegans period homolog lin-42 regulates the timing of heterochronic miRNA expression.Proc Natl Acad Sci U S A. 2014 Oct 28;111(43):15450-5. doi: 10.1073/pnas.1414856111. Epub 2014 Oct 15. Proc Natl Acad Sci U S A. 2014. PMID: 25319259 Free PMC article.
-
Regulation of nuclear-cytoplasmic partitioning by the lin-28-lin-46 pathway reinforces microRNA repression of HBL-1 to confer robust cell-fate progression in C. elegans.Development. 2019 Nov 6;146(21):dev183111. doi: 10.1242/dev.183111. Development. 2019. PMID: 31597658 Free PMC article.
-
Regulation by let-7 and lin-4 miRNAs results in target mRNA degradation.Cell. 2005 Aug 26;122(4):553-63. doi: 10.1016/j.cell.2005.07.031. Cell. 2005. PMID: 16122423
-
C. elegans microRNAs.WormBook. 2005 Sep 21:1-9. doi: 10.1895/wormbook.1.26.1. WormBook. 2005. PMID: 18050425 Free PMC article. Review.
-
Translational control of endogenous microRNA target genes in C. elegans.Prog Mol Subcell Biol. 2010;50:21-40. doi: 10.1007/978-3-642-03103-8_2. Prog Mol Subcell Biol. 2010. PMID: 19841879 Review.
Cited by
-
Small interfering RNA-mediated translation repression alters ribosome sensitivity to inhibition by cycloheximide in Chlamydomonas reinhardtii.Plant Cell. 2013 Mar;25(3):985-98. doi: 10.1105/tpc.113.109256. Epub 2013 Mar 19. Plant Cell. 2013. PMID: 23512853 Free PMC article.
-
Cooperative target mRNA destabilization and translation inhibition by miR-58 microRNA family in C. elegans.Genome Res. 2015 Nov;25(11):1680-91. doi: 10.1101/gr.183160.114. Epub 2015 Jul 31. Genome Res. 2015. PMID: 26232411 Free PMC article.
-
Conserved translatome remodeling in nematode species executing a shared developmental transition.PLoS Genet. 2013;9(10):e1003739. doi: 10.1371/journal.pgen.1003739. Epub 2013 Oct 3. PLoS Genet. 2013. PMID: 24098135 Free PMC article.
-
Trip to ER: MicroRNA-mediated translational repression in plants.RNA Biol. 2013 Oct;10(10):1586-92. doi: 10.4161/rna.26313. Epub 2013 Sep 10. RNA Biol. 2013. PMID: 24100209 Free PMC article.
-
A Genetic Cascade of let-7-ncl-1-fib-1 Modulates Nucleolar Size and rRNA Pool in Caenorhabditis elegans.PLoS Genet. 2015 Oct 22;11(10):e1005580. doi: 10.1371/journal.pgen.1005580. eCollection 2015 Oct. PLoS Genet. 2015. PMID: 26492166 Free PMC article.
References
-
- Abrahante J, Daul A, Li M, Volk M, Tennessen J, Miller E, Rougvie A 2003. The Caenorhabditis elegans hunchback-like gene lin-57/hbl-1 controls developmental time and is regulated by microRNAs. Dev Cell 4: 625–637 - PubMed
-
- Ambros V, Horvitz H 1987. The lin-14 locus of Caenorhabditis elegans controls the time of expression of specific postembryonic developmental events. Genes Dev 1: 398–414 - PubMed
-
- Bagga S, Bracht J, Hunter S, Massirer K, Holtz J, Eachus R, Pasquinelli AE 2005. Regulation by let-7 and lin-4 miRNAs results in target mRNA degradation. Cell 122: 553–563 - PubMed
Publication types
MeSH terms
Substances
Grants and funding
LinkOut - more resources
Full Text Sources
Other Literature Sources
Research Materials
Miscellaneous