. 2012 Sep;25(9):1888-96.
doi: 10.1111/j.1420-9101.2012.02579.x. Epub 2012 Aug 1.

Fecundity compensation and tolerance to a sterilizing pathogen in Daphnia

Affiliations
Free PMC article

Fecundity compensation and tolerance to a sterilizing pathogen in Daphnia

P F Vale et al. J Evol Biol. 2012 Sep.
Free PMC article

Abstract

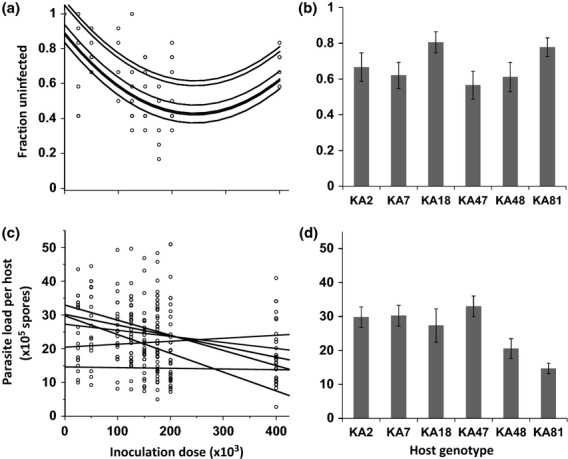
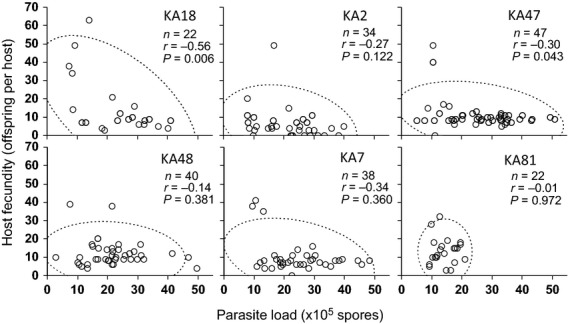
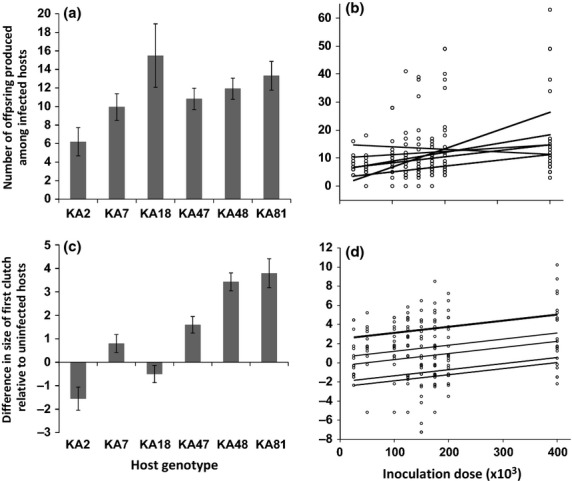
Hosts are armed with several lines of defence in the battle against parasites: they may prevent the establishment of infection, reduce parasite growth once infected or persevere through mechanisms that reduce the damage caused by infection, called tolerance. Studies on tolerance in animals have focused on mortality, and sterility tolerance has not been investigated experimentally. Here, we tested for genetic variation in the multiple steps of defence when the invertebrate Daphnia magna is infected with the sterilizing bacterial pathogen Pasteuria ramosa: anti-infection resistance, anti-growth resistance and the ability to tolerate sterilization once infected. When exposed to nine doses of a genetically diverse pathogen inoculum, six host genotypes varied in their average susceptibility to infection and in their parasite loads once infected. How host fecundity changed with increasing parasite loads did not vary between genotypes, indicating that there was no genetic variation for this measure of fecundity tolerance. However, genotypes differed in their level of fecundity compensation under infection, and we discuss how, by increasing host fitness without targeting parasite densities, fecundity compensation is consistent with the functional definition of tolerance. Such infection-induced life-history shifts are not traditionally considered to be part of the immune response, but may crucially reduce harm (in terms of fitness loss) caused by disease, and are a distinct source of selection on pathogens.


Figures

Figure 1
Figure 1
Resistance to infection and within-host growth. (a) Each line is the least-squares regression for the fraction of uninfected individuals for each host genotype plotted against inoculation dose, obtained from the best generalized linear model (F7,46 = 9.43, P < 0.0001, R2 = 0.59; see Table 1). (b) The mean fraction of uninfected (± standard errors), across all inoculation doses, for each host genotype. (c) Least-squares regressions for the number of parasite spores per infected host (parasite load), plotted against inoculation dose, for each host genotype, obtained from the best generalized linear model (F11,191 = 4.39, P < 0.0001, R2 = 0.20; see Table 1). (d) The mean parasite load (± standard errors), across all inoculation doses, for each host genotype.
Figure 2
Figure 2
The correlation between host fecundity and parasite load. Measured on day 40 post-infection for each host genotype and for all inoculation doses. Negative correlations indicate a loss of fecundity with increasing parasite load, whereas correlations not different from zero suggest that host genotypes tolerate increasing parasite loads without suffering a reduction in fecundity. Note that while we present the individual correlation coefficients, a complete analysis revealed no significant difference in the correlation between host genotypes (see text for details). Ellipses are 95% confidence intervals. r, Pearson’s correlation coefficient; n, sample size.
Figure 3
Figure 3
Fecundity compensation. (a) The mean number of offspring (± standard errors), across all inoculation doses, for each host genotype. (b) Least-squares regressions for the number of offspring per infected host, plotted against inoculation dose, for each host genotype, obtained from the best generalized linear model (F11,190 = 4.23, P < 0.0001, R2 = 0.20; see Table 1). (c) The mean level of fecundity compensation (± standard errors), measured as the difference in number of offspring of the first clutch had by infected individuals, relative to the first clutch of uninfected individuals of the same genotype. (d) Least-squares regressions for the level of fecundity compensation, plotted against inoculation dose, for each host genotype, obtained from the best generalized linear model (F6,195 = 922.07, P < 0.0001, R2 = 0.40; see Table 1).

References

    1. Agrawal A, Lively CM. Infection genetics: gene-for-gene versus matching-alleles models and all points in between. Evol. Ecol. Res. 2002;4:79–90.
    1. Agrawal AF, Lively CM. Modelling infection as a two-step process combining gene-for-gene and matching-allele genetics. Proc. R. Soc. Lond. B. 2003;270:323–334. - PMC - PubMed
    1. Altincicek B, Gross J, Vilcinskas A. Wounding-mediated gene expression and accelerated viviparous reproduction of the pea aphid Acyrthosiphon pisum. Insect Mol. Biol. 2008;17:711–716. - PubMed
    1. Anderson RM, May RM. Vaccination and herd immunity to infectious diseases. Nature. 1985;318:323–329. - PubMed
    1. Ayres JS, Schneider DS. A signaling protease required for melanization in drosophila affects resistance and tolerance of infections. PLoS Biol. 2008;6:e305. - PMC - PubMed

Publication types