. 2012 Aug 28;28(34):12581-7.
doi: 10.1021/la302473j. Epub 2012 Aug 16.

Virus-poly(3,4-ethylenedioxythiophene) biocomposite films

Affiliations

Virus-poly(3,4-ethylenedioxythiophene) biocomposite films

Keith C Donavan et al. Langmuir. .

Abstract

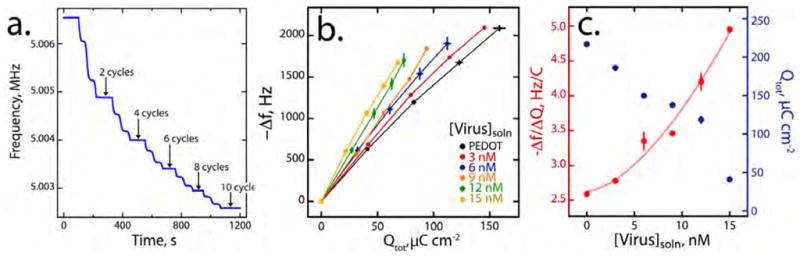
Virus-poly(3,4-ethylenedioxythiophene) (virus-PEDOT) biocomposite films are prepared by electropolymerizing 3,4-ethylenedioxythiophene (EDOT) in aqueous electrolytes containing 12 mM LiClO(4) and the bacteriophage M13. The concentration of virus in these solutions, [virus](soln), is varied from 3 to 15 nM. A quartz crystal microbalance is used to directly measure the total mass of the biocomposite film during its electrodeposition. In combination with a measurement of the electrodeposition charge, the mass of the virus incorporated into the film is calculated. These data show that the concentration of the M13 within the electropolymerized film, [virus](film), increases linearly with [virus](soln). The incorporation of virus particles into the PEDOT film from solution is efficient, resulting in a concentration ratio of [virus](film):[virus](soln) ≈ 450. Virus incorporation into the PEDOT causes roughening of the film topography that is observed using scanning electron microscopy and atomic force microscopy (AFM). The electrical conductivity of the virus-PEDOT film, measured perpendicular to the plane of the film using conductive tip AFM, decreases linearly with virus loading, from 270 μS/cm for pure PEDOT films to 50 μS/cm for films containing 100 μM virus. The presence on the virus surface of displayed affinity peptides did not significantly influence the efficiency of incorporation into virus-PEDOT biocomposite films.


Figures

Figure 1
Figure 1
Electrodeposition of a virus-PEDOT composite film. a) Anodic polymerization at 20 mV/s of EDOT only at a gold electrode. The solution was aqueous 12.5 mM LiClO4, 2.5 mM EDOT. b) Anodic polymerization at 20 mV/s of EDOT in the presence of M13 virus at the indicated concentrations. c) Deposition charge versus cycle number for the growth of PEDOT and virus- PEDOT films as a function of the virus concentration as indicated. d) Deposition rate versus [virus]soln, obtained from the slope of the plots shown in (c), and film thickness, measured by AFM, versus versus [virus]soln. Error bars represent the rms roughness of these film surfaces.
Figure 2
Figure 2
Topography of virus-PEDOT films imaged by scanning electron microscopy at two magnifications. All films were prepared using 10 deposition cycles (20 mV/s) from a solution of aqueous 12.5 mM LiClO4, 2.5 mM EDOT and virus particles at three concentrations: a,b) [virus]soln = 3nM, c,d) [virus]soln = 9 nM, e,f) [virus]soln = 15 nM.
Figure 3
Figure 3
Voltammetry of virus-PEDOT films: (a) Steady-state cyclic voltammetry of PEDOT only(black) and virus-PEDOT films (colors, as indicated) in aqueous 12.5 nM LiClO4 for virus- PEDOT films prepared using ten deposition scans. The virus concentration in the polymerization solution, [virus]soln, is indicated. (b) Capacitance versus [virus]soln derived from the cyclic voltammograms shown in (a). (c) Capacitance versus deposition charge, Qtot, for PEDOT and virus-PEDOT films showing that the total film capacitance is unaffected by the incorporation of virus from solution.
Figure 4
Figure 4
Concurrent topographic (a,c) and conductive tip AFM (c-AFM, b,d) images (20 μm × 20 μm) of two films: a) a PEDOT film showing smooth morphology (rms roughness ≈ 20 nm). b) Map of the c-AFM tip-film current as a function of position acquired simultaneously with the topography image shown in (a). An imaging bias of 500 mV was used for the acquisition of this data. (c) a virus-PEDOT film prepared from a 9 nM loading solution (rms roughness ≈ 200 nm). (d) Map of the c-AFM tip-film current as a function of position acquired simultaneously with the topography image shown in (c). An imaging bias of 2 V was used for the acquisition of this image, which is characterized by a highly corrugated electrical conductivity with a high conductivity at protrusions seen in (c). (e) Calculated mean film conductivity, σ, and rms roughness as a function of the virus concentration in the polymerization solution. Error bars represent ± 1 st. dev. for the spatial variability of σ
Figure 5
Figure 5
Quartz crystal microbalance (QCM) analyses of film growth. (a) Raw, in-situ QCM frequency versus time trace obtained during the electrodeposition of a PEDOT film on a gold-coated QCM crystal. The number of electrodeposition cycles - as shown in Fig 1a,b - are indicated. The frequency-to-mass conversion factor for the QCM is: 55.9 ± 0.7 Hz cm2 μg −1. (b) Frequency versus deposition charge for QCM crystal measurements. (c) The change in frequency over the change in total charge (b) (left) and total deposition charge (right) versus virus concentration indicate corresponding trends upon increasing virus concentration in the deposition solution.
Figure 6
Figure 6
QCM data for dried PEDOT and virus-PEDOT films. (a) Change in frequency of dried virus-PEDOT films with various concentrations of virus incorporated versus deposition charge. A calibration was generated using PEDOT only films as seen in black to compare mass versus charge data. The frequency-to-mass conversion factor for the QCM is: 49.0 ± 0.7 Hz cm2 μg −1 (b) Calibration curve for surface coverage of viruses in films versus concentration of virus in solution. Viruses with peptides displayed on their surface, prostate specific membrane antigen (PSMA) binding peptides (red) and bovine serum albumin (BSA) binding peptides (blue), were also incorporated to show that the presence of a displayed nonnatural polypeptide on the virus surface has little influence on its propensity to be incorporated into the PEDOT film.
Scheme 1
Scheme 1
The electropolymerization of PEDOT in electrolytes containing perchlorate (top) and M13.

Similar articles

Cited by

References

    1. Cen L, Neoh K, Kang E. Langmuir. 2002;18:8633–8640.
    1. Widge AS, Jefferies-El M, Cui X, Lagenaur CF, Matsuoka Y. Biosens Bioelectron. 2007;22:1723–1732. - PubMed
    1. Richardson-Burns SM, Hendricks JL, Foster B, Povlich LK, Kim DH, Martin DC. Biomaterials. 2007;28:1539–1552. - PMC - PubMed
    1. You J, Yoshida A, Heo JS, Kim HS, Kim HO, Tamada K, Kim E. Phys Chem Chem Phys. 2011;13:17625–17632. - PubMed
    1. Rivers TJ, Hudson TW, Schmidt CE. Adv Funct Mater. 2002;12:33–37.

Publication types