. 2012 Sep;135(Pt 9):2766-78.
doi: 10.1093/brain/aws183. Epub 2012 Aug 1.

Subthalamic nucleus activity optimizes maximal effort motor responses in Parkinson's disease

Affiliations

Subthalamic nucleus activity optimizes maximal effort motor responses in Parkinson's disease

Anam Anzak et al. Brain. 2012 Sep.

Abstract

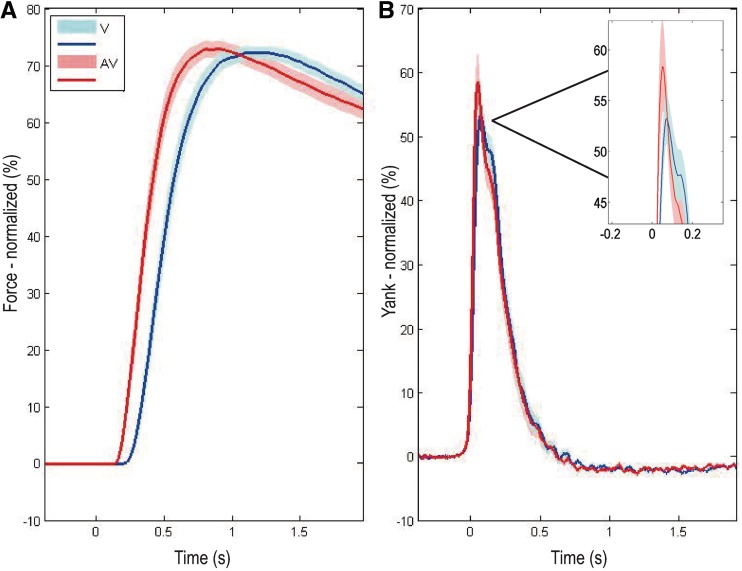
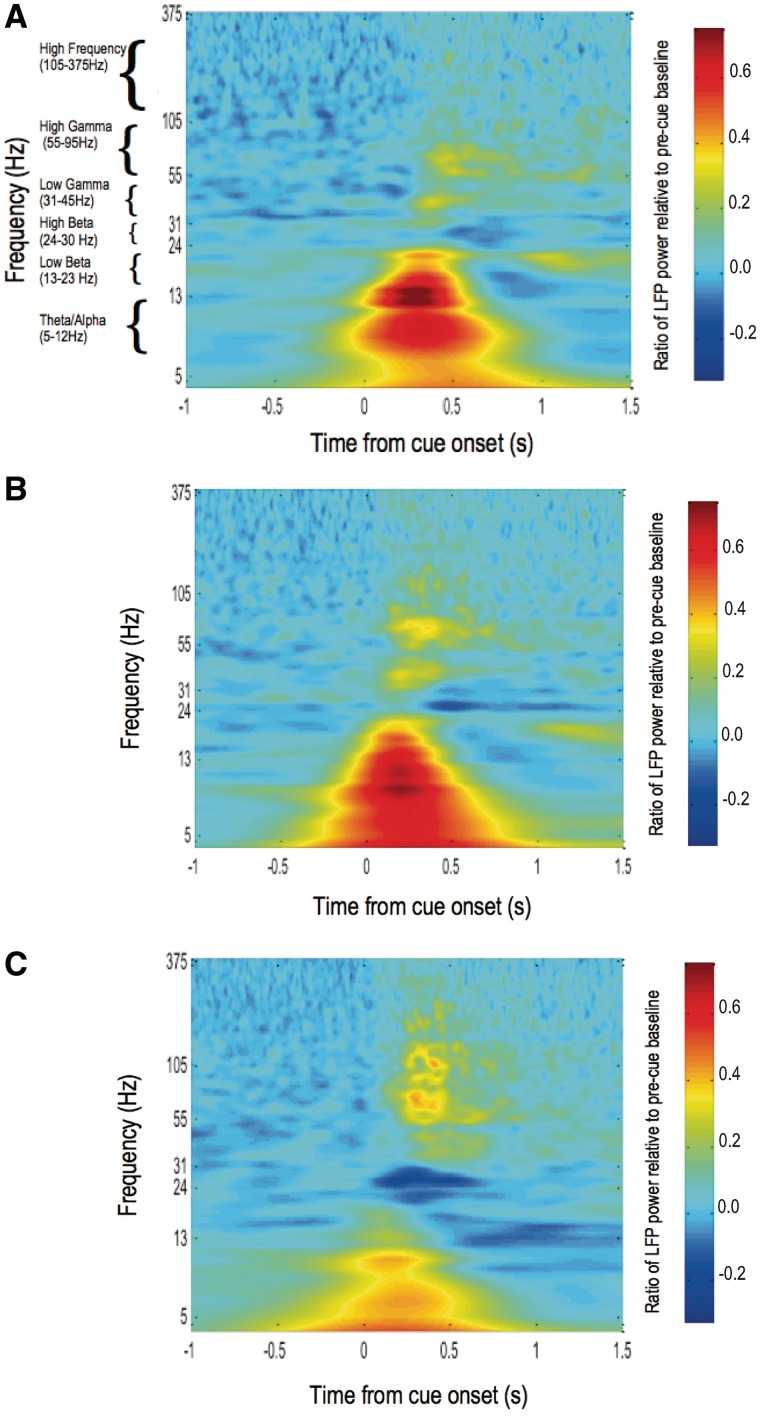
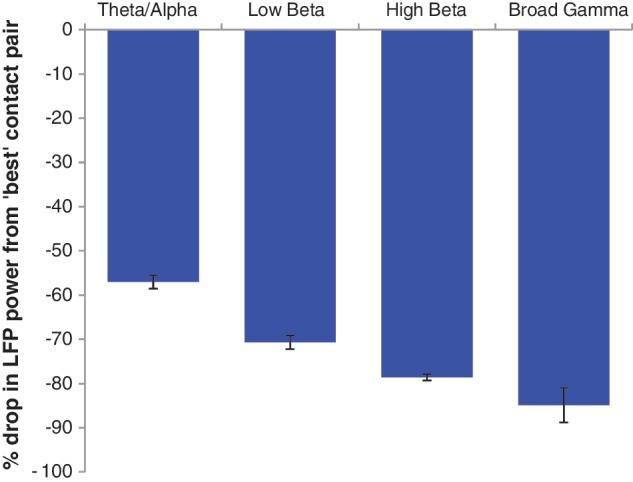
The neural substrates that enable individuals to achieve their fastest and strongest motor responses have long been enigmatic. Importantly, characterization of such activities may inform novel therapeutic strategies for patients with hypokinetic disorders, such as Parkinson's disease. Here, we ask whether the basal ganglia may play an important role, not only in the attainment of maximal motor responses under standard conditions but also in the setting of the performance enhancements known to be engendered by delivery of intense stimuli. To this end, we recorded local field potentials from deep brain stimulation electrodes implanted bilaterally in the subthalamic nuclei of 10 patients with Parkinson's disease, as they executed their fastest and strongest handgrips in response to a visual cue, which was accompanied by a brief 96-dB auditory tone on random trials. We identified a striking correlation between both theta/alpha (5-12 Hz) and high-gamma/high-frequency (55-375 Hz) subthalamic nucleus activity and force measures, which explained close to 70% of interindividual variance in maximal motor responses to the visual cue alone, when patients were ON their usual dopaminergic medication. Loud auditory stimuli were found to enhance reaction time and peak rate of development of force still further, independent of whether patients were ON or OFF l-DOPA, and were associated with increases in subthalamic nucleus power over a broad gamma range. However, the contribution of this broad gamma activity to the performance enhancements observed was only modest (≤13%). The results implicate frequency-specific subthalamic nucleus activities as substantial factors in optimizing an individual's peak motor responses at maximal effort of will, but much less so in the performance increments engendered by intense auditory stimuli.


Figures

Figure 1
Figure 1
Putative relationship between frequency-specific LFP power and peak yank (PY), shown for three hypothetical individuals (Cases A, B and C). The continuous black line labelled ‘RL’ is the regression line fitting the LFP power relationship with peak yank, under baseline conditions (response to visual cues, when patients ON l-DOPA), across subjects. The interrupted black line, labelled ‘MLM’ is estimated by multi-level modelling on the basis of experimental condition-specific regression coefficients between frequency-specific LFPs and peak yank, corrected to each individual’s baseline performance. It thus models ‘within-subject’ effects of experimental manipulations from standard conditions. An average experimental condition-specific intercept shift of the MLM line from baseline would implicate increments or decrements in motor performance independent of frequency-specific subthalamic nucleus LFP power. Such an average shift would equate to the shift of curve A to curve B, whilst maintaining the gradient of the MLM line (translation of interrupted black line to the position of the interrupted grey line).
Figure 2
Figure 2
(A) Sustained maximal force grips, in response to a visual (V) cue illuminated for 5 s, when patients with Parkinson’s disease were ON dopaminergic medication. In this panel, time zero represents cue onset, so that each individual’s average reaction times can be discerned. Average grip traces for left and right hands are presented and are normalized as a percentage of the maximal voluntary contraction achieved, by each hand, respectively, under this condition. Note, as can be seen in the figure, those trials in which subjects were slow in releasing the maximal grip were not excluded from further analysis, as the motor parameters of interest in this study fell at much earlier latencies. (B) Yank (rate of development of force), averaged after realignment to response onset following a visual cue, when patients with Parkinson’s disease were ON dopaminergic medication. Traces have been normalized as in A. Each patient is colour-coded with the same colour in A and B.
Figure 3
Figure 3
Average time–frequency plot of change in induced spectral power in 20 subthalamic nuclei contralateral to sustained maximal handgrips, relative to a pre-cue baseline. Time zero represents onset of the imperative visual (V) cue. Patients were recorded ON their normal dopaminergic medication. Colour gradient represents ratio of post-cue LFP power to average LFP power 1–2 s before cue onset. Lines labelled RT, TPY and TPF demarcate the average premotor reaction time, time to peak yank and time to peak force, under this condition, respectively. Frequency is plotted on a log axis.
Figure 4
Figure 4
Scatter-graphs relating LFP power to performance. Continuous and interrupted lines represent the best fit and corresponding 95% confidence limits estimated by linear regression. Significant correlations with peak yank, peak force and reaction time were found in the theta/alpha (5–12 Hz) band, and with peak yank and peak force in the high-gamma/high-frequency (55–375 Hz) range. No correlations were found in the beta (13–30 Hz) band. Non-significant correlations are not illustrated.
Figure 5
Figure 5
(A) Group average grip force achieved in visual (V) and auditory–visual (AV) trials across patients (n = 20 hands), averaged across OFF and ON l-DOPA conditions. Time zero represents cue onset. For the purposes of graphical representation only (Anzak et al., 2011a, b), group average traces have been derived as the mean of the average responses of each gripping hand to visual and auditory–visual cues, normalized as a percentage of the average maximal voluntary contraction achieved in the visual condition when patients were ON and OFF l-DOPA (Fig. 2). Shaded area represents SEM. of the trace. (B) Group average yank (rate of development of force) achieved in visual and auditory–visual trials, averaged across OFF and ON l-DOPA conditions. Traces have been averaged after realignment to response onset. Significant reductions in reaction time and enhancements in peak yank (see boxed expansion of the peak difference), but no change in peak force, are evident in response to auditory–visual as compared with visual cues.
Figure 6
Figure 6
Matrices of average time–frequency plots of change in induced spectral power in 20 subthalamic nuclei contralateral to sustained maximal hand grips, relative to a pre-cue baseline, under different experimental manipulations. Time zero represents onset of the imperative visual or loud auditory–visual cue. Colour gradient represents ratio of post-cue LFP power to average LFP power 1–2 s before cue onset. Spectral changes under three different experimental conditions are represented as (A) OFF L-DOPA, visual cue; (B) OFF l-DOPA, auditory-visual cue and (C) ON l-DOPA, auditory–visual cue. The spectral changes in the baseline condition, ON l-DOPA, visual cue state are shown in Fig 2. Power changes common to each experimental condition occurred over six frequency bands: theta/alpha (5–12 Hz), low beta (13–23 Hz), high beta (24–30 Hz), low gamma (31–45 Hz), high gamma (55–95 Hz), and high frequency (105–375 Hz). Frequency is plotted on a log axis.
Figure 7
Figure 7
Mean ± SEM percentage drop in LFP power from the contact pair recording the greatest power change from baseline, for each frequency band, averaged across experimental condition.

References

    1. Angel A. Input-output relations in simple reaction time experiments. J Exp Psychol. 1973;25:193–200. - PubMed
    1. Anzak A, Tan H, Pogosyan A, Djamshidian A, Ling H, Lees A, et al. Improvements in rate of development and magnitude of force with intense auditory stimuli in patients with Parkinson's disease. Eur J Neurosci. 2011a;34:124–32. - PubMed
    1. Anzak A, Tan H, Pogosyan A, Brown P. Doing better than your best: loud auditory stimulation yields improvements in maximal voluntary force. Exp Brain Res. 2011b;208:237–43. - PubMed
    1. Aravamuthan BR, McNab JA, Miller KL, Rushworth M, Jenkinson N, Stein JF, et al. Cortical and subcortical connections within the pedunculopontine nucleus of the primate Macaca mulatta determined using probabilistic diffusion tractography. J Clin Neurosci. 2009;16:413–20. - PubMed
    1. Ballanger B, Thobois B, Batusche P, Turner RS, Brouselle E, Desmurget M. “Paradoxical kinesis” is not a hallmark of Parkinson’s disease but a general property of the motor system. Mov Disord. 2006;21:1490–5. - PubMed

Publication types