

Evaluating the use of a continuous approximation for model-based quantification of pulsed chemical exchange saturation transfer (CEST)
- PMID: 22858666
- PMCID: PMC3431007
- DOI: 10.1016/j.jmr.2012.07.003
Evaluating the use of a continuous approximation for model-based quantification of pulsed chemical exchange saturation transfer (CEST)
Abstract
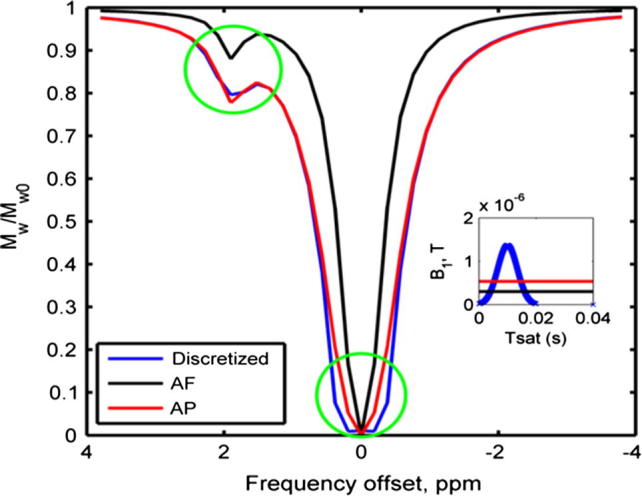
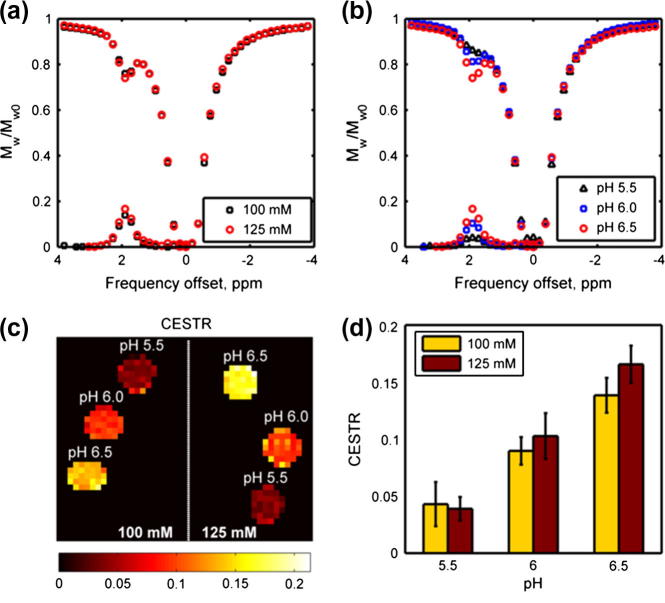
Many potential clinical applications of chemical exchange saturation transfer (CEST) have been studied in recent years. However, due to various limitations such as specific absorption rate guidelines and scanner hardware constraints, most of the proposed applications have yet to be translated into routine diagnostic tools. Currently, pulsed CEST which uses multiple short pulses to perform the saturation is the only viable irradiation scheme for clinical translation. However, performing quantitative model-based analysis on pulsed CEST is time consuming because it is necessary to account for the time dependent amplitude of the saturation pulses. As a result, pulsed CEST is generally treated as continuous CEST by finding its equivalent average field or power. Nevertheless, theoretical analysis and simulations reveal that the resulting magnetization is different when the different irradiation schemes are applied. In this study, the quantification of important model parameters such as the amine proton exchange rate from a pulsed CEST experiment using quantitative model-based analyses were examined. Two model-based approaches were considered - discretized and continuous approximation to the time dependent RF irradiation pulses. The results showed that the discretized method was able to fit the experimental data substantially better than its continuous counterpart, but the smaller fitted error of the former did not translate to significantly better fit for the important model parameters. For quantification of the endogenous CEST effect, such as in amide proton transfer imaging, a model-based approach using the average power equivalent saturation can thus be used in place of the discretized approximation.
Copyright © 2012 Elsevier Inc. All rights reserved.
Figures


Similar articles
-
Simulation and optimization of pulsed radio frequency irradiation scheme for chemical exchange saturation transfer (CEST) MRI-demonstration of pH-weighted pulsed-amide proton CEST MRI in an animal model of acute cerebral ischemia.Magn Reson Med. 2011 Oct;66(4):1042-8. doi: 10.1002/mrm.22894. Epub 2011 Mar 24. Magn Reson Med. 2011. PMID: 21437977 Free PMC article.
-
A review of optimization and quantification techniques for chemical exchange saturation transfer MRI toward sensitive in vivo imaging.Contrast Media Mol Imaging. 2015 May-Jun;10(3):163-178. doi: 10.1002/cmmi.1628. Epub 2015 Jan 12. Contrast Media Mol Imaging. 2015. PMID: 25641791 Free PMC article. Review.
-
Investigation of optimizing and translating pH-sensitive pulsed-chemical exchange saturation transfer (CEST) imaging to a 3T clinical scanner.Magn Reson Med. 2008 Oct;60(4):834-41. doi: 10.1002/mrm.21714. Magn Reson Med. 2008. PMID: 18816867 Free PMC article.
-
Advantages of chemical exchange-sensitive spin-lock (CESL) over chemical exchange saturation transfer (CEST) for hydroxyl- and amine-water proton exchange studies.NMR Biomed. 2014 Nov;27(11):1313-24. doi: 10.1002/nbm.3191. Epub 2014 Sep 9. NMR Biomed. 2014. PMID: 25199631 Free PMC article.
-
Chemical Exchange Saturation Transfer MRI: What Neuro-Oncology Clinicians Need To Know.Technol Cancer Res Treat. 2023 Jan-Dec;22:15330338231208613. doi: 10.1177/15330338231208613. Technol Cancer Res Treat. 2023. PMID: 37872686 Free PMC article. Review.
Cited by
-
Inverse Z-spectrum analysis for spillover-, MT-, and T1 -corrected steady-state pulsed CEST-MRI--application to pH-weighted MRI of acute stroke.NMR Biomed. 2014 Mar;27(3):240-52. doi: 10.1002/nbm.3054. Epub 2014 Jan 3. NMR Biomed. 2014. PMID: 24395553 Free PMC article.
-
Quantitative chemical exchange saturation transfer imaging of nuclear overhauser effects in acute ischemic stroke.Magn Reson Med. 2022 Jul;88(1):341-356. doi: 10.1002/mrm.29187. Epub 2022 Mar 7. Magn Reson Med. 2022. PMID: 35253936 Free PMC article.
-
Quantification of amide proton transfer effect pre- and post-gadolinium contrast agent administration.J Magn Reson Imaging. 2014 Oct;40(4):832-8. doi: 10.1002/jmri.24441. Epub 2013 Nov 8. J Magn Reson Imaging. 2014. PMID: 24214526 Free PMC article.
-
Quantitative CEST imaging of amide proton transfer in acute ischaemic stroke.Neuroimage Clin. 2019;23:101833. doi: 10.1016/j.nicl.2019.101833. Epub 2019 Apr 23. Neuroimage Clin. 2019. PMID: 31063943 Free PMC article.
-
Does the magnetization transfer effect bias chemical exchange saturation transfer effects? Quantifying chemical exchange saturation transfer in the presence of magnetization transfer.Magn Reson Med. 2020 Sep;84(3):1359-1375. doi: 10.1002/mrm.28212. Epub 2020 Feb 18. Magn Reson Med. 2020. PMID: 32072677 Free PMC article.
References
-
- Zhou J., Zijl P.C.M.V. Chemical exchange saturation transfer imaging and spectroscopy. Prog. Nucl. Magn. Reson. Spectrosc. 2006;48:109–136.
-
- Zhou J., Lal B., Wilson D.A., Laterra J., Van Zijl P.C.M. Amide proton transfer (APT) contrast for imaging of brain tumors. Magn. Reson. Med. 2003;50:1120–1126. - PubMed
Publication types
MeSH terms
Substances
Grants and funding
LinkOut - more resources
Full Text Sources
Medical
Research Materials
