. 2012 Aug 2;488(7409):86-90.
doi: 10.1038/nature11237.

Defining the core Arabidopsis thaliana root microbiome

Affiliations

Defining the core Arabidopsis thaliana root microbiome

Derek S Lundberg et al. Nature. .

Abstract

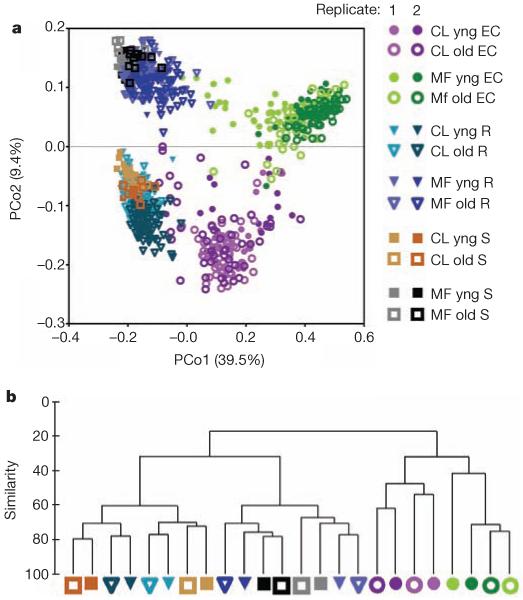
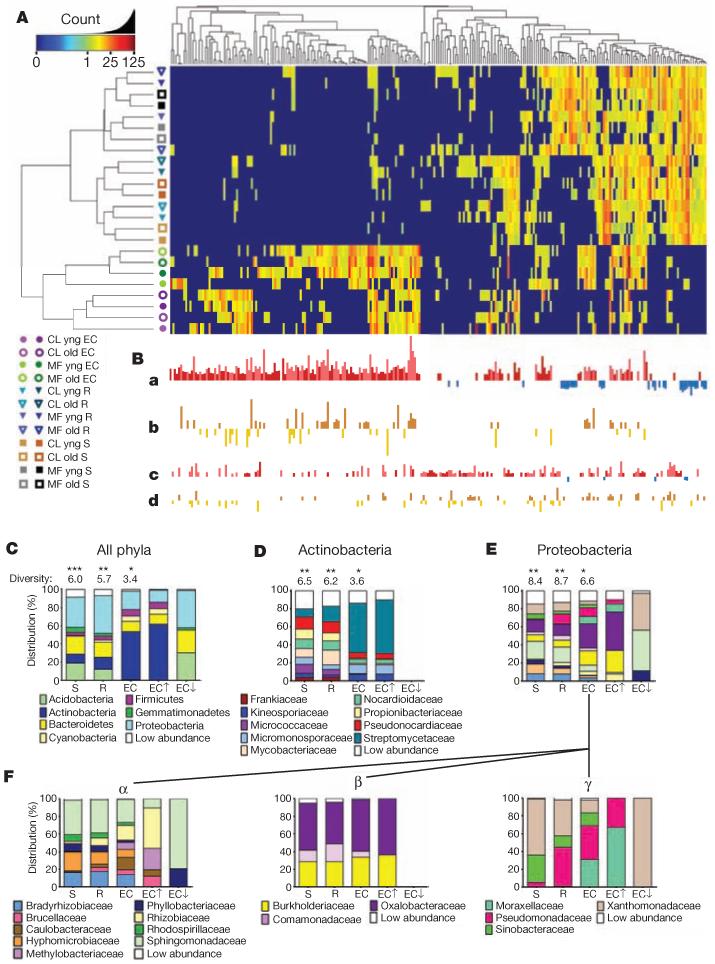
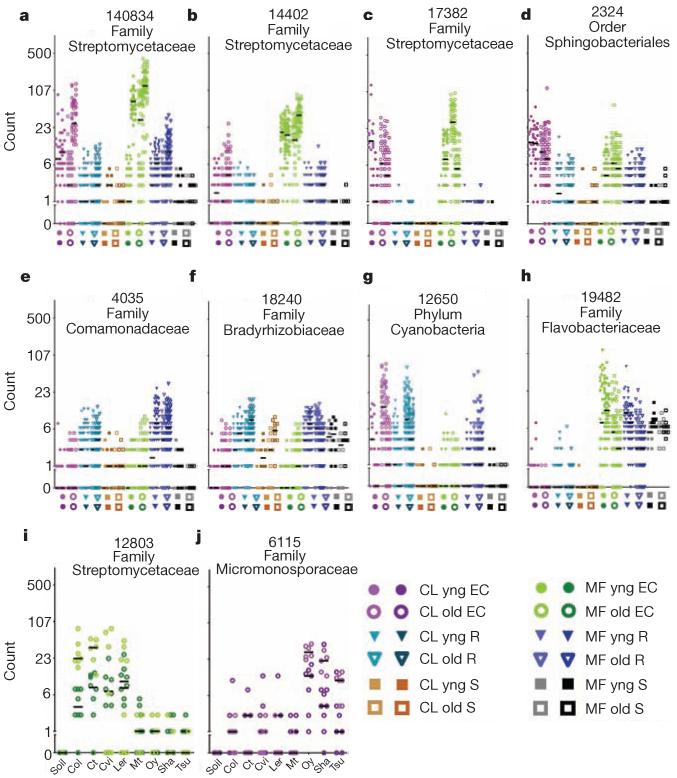
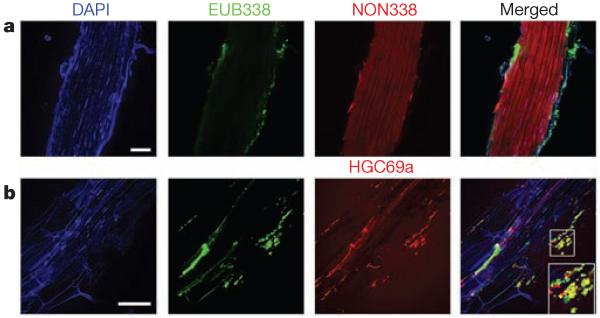
Land plants associate with a root microbiota distinct from the complex microbial community present in surrounding soil. The microbiota colonizing the rhizosphere (immediately surrounding the root) and the endophytic compartment (within the root) contribute to plant growth, productivity, carbon sequestration and phytoremediation. Colonization of the root occurs despite a sophisticated plant immune system, suggesting finely tuned discrimination of mutualists and commensals from pathogens. Genetic principles governing the derivation of host-specific endophyte communities from soil communities are poorly understood. Here we report the pyrosequencing of the bacterial 16S ribosomal RNA gene of more than 600 Arabidopsis thaliana plants to test the hypotheses that the root rhizosphere and endophytic compartment microbiota of plants grown under controlled conditions in natural soils are sufficiently dependent on the host to remain consistent across different soil types and developmental stages, and sufficiently dependent on host genotype to vary between inbred Arabidopsis accessions. We describe different bacterial communities in two geochemically distinct bulk soils and in rhizosphere and endophytic compartments prepared from roots grown in these soils. The communities in each compartment are strongly influenced by soil type. Endophytic compartments from both soils feature overlapping, low-complexity communities that are markedly enriched in Actinobacteria and specific families from other phyla, notably Proteobacteria. Some bacteria vary quantitatively between plants of different developmental stage and genotype. Our rigorous definition of an endophytic compartment microbiome should facilitate controlled dissection of plant-microbe interactions derived from complex soil communities.


Figures

Figure 1
Figure 1. Sample fraction and soil type drive the microbial composition of root-associated endophyte communities
a, Principal coordinate analysis of pairwise, normalized, weighted UniFrac distances between samples based on rarefaction to 1,000 reads in unthresholded, usable OTUs. CL, Clayton; MF, Mason Farm; R, rhizosphere; S, soil. b, Rarefied counts for the 25 × 5 thresholded, measurable OTUs from each of 24 soil, stage or fraction groups were log2-transformed (Methods) to make 24 representative samples (branch labels), and pairwise Bray–Curtis similarity was used to cluster these representatives hierarchically (group-average linkage).
Figure 2
Figure 2. OTUs that differentiate the EC and rhizosphere from soil
A, Heat map showing OTU counts from the rarefied OTU table (Supplementary Database 2a; log2-transformed) from each of the 256 rhizosphere- and EC-differentiating OTUs present across replicates. Samples and OTUs are clustered on their Bray–Curtis similarities (group-average linkage). The key relates colours to the untransformed read counts. Different hues of the same colour correspond to different replicates as in Fig. 1. B, The strength of GLMM predictions (best linear unbiased predictors) is represented by bar height. a, OTUs predicted as EC enriched (red, up) or EC depleted (blue, down). b, OTUs higher in the EC in Mason Farm soil than Clayton (brown, up) or higher in Clayton soil than Mason Farm (gold, down). OTUs in a that are not differentially affected by soil type are shown there in darker hues. c, OTUs predicted as rhizosphere enriched (as in a). d, OTUs higher in rhizosphere in one soil type (as in b). C, Histograms showing the distributions of phyla present in the 778 measurable OTUs in soil, rhizosphere and ECs compared with phyla present in the subset of EC OTUs enriched (EC↑) or depleted (EC↓) relative to soil. Shannon diversity (considering phyla as individuals) is given above each bar. A differential number of asterisks above the diversity values represents a significant difference (P < 0.05, weighted analysis of variance; Supplementary Methods and Supplementary Table 5). D, Distribution of families present among the OTUs from the phylum Actinobacteria. E, Distribution of families present among the OTUs from the phylum Proteobacteria. F, Distribution of families present among the OTUs of three classes of the phylum Proteobacteria: Alphaproteobacteria (α), Betaproteobacteria (β) and Gammaproteobacteria (γ). Statistical evidence for presence, enrichment in or depletion from EC is in Supplementary Table 6.
Figure 3
Figure 3. Dot plots of notable OTUs
Counts for each OTU (number at top keyed to Supplementary Table 3) from the rarefied table were log2-transformed and the counts for each sample plotted as an individual symbol. The y axis is labelled with the actual (untransformed) counts. a–h, Each position on the x axis is labelled with a symbol to represent the sample group, and samples from that group are plotted in the column directly above. Biological replicates in the same column have different hues. The median of each replicate is shown with a horizontal black bar; some are invisible because they are at 0. i, j, Each x-axis position is labelled by Arabidopsis accession; samples from that accession are plotted above each label. Each OTU in the figure has model predictions in several categories (Supplementary Table 3).
Figure 4
Figure 4. CARD–FISH confirmation of Actinobacteria on roots
A single set of Mason Farm yng Col-0 roots were fixed and stained using CARD–FISH. DAPI, 4′,6-diamidino-2-phenylindole. Double CARD–FISH was applied using the EUB338 eubacterial probe (green) and either the NON338 probe (a), which is the nonsense negative control of EUB338, or the HGC69a Actinobacteria probe (b). Inset, twofold enlargement of boxed region. Scale bars, 50 μm.

References

    1. Rodriguez RJ, et al. Stress tolerance in plants via habitat-adapted symbiosis. ISME J. 2008;2:404–416. - PubMed
    1. De Deyn GB, Cornelissen JHC, Bardgett RD. Plant functional traits and soil carbon sequestration in contrasting biomes. Ecol. Lett. 2008;11:516–531. - PubMed
    1. van der Lelie D, et al. Poplar and its bacterial endophytes: coexistence and harmony. Crit. Rev. Plant Sci. 2009;28:346–358.
    1. Jones JDG, Dangl JL. The plant immune system. Nature. 2006;444:323–329. - PubMed
    1. Dodds PN, Rathjen JP. Plant immunity: towards an integrated view of plant-pathogen interactions. Nature Rev. Genet. 2010;11:539–548. - PubMed

Publication types

MeSH terms

Substances