

Loss of Mfn2 results in progressive, retrograde degeneration of dopaminergic neurons in the nigrostriatal circuit
- PMID: 22859504
- PMCID: PMC3607482
- DOI: 10.1093/hmg/dds311
Loss of Mfn2 results in progressive, retrograde degeneration of dopaminergic neurons in the nigrostriatal circuit
Abstract
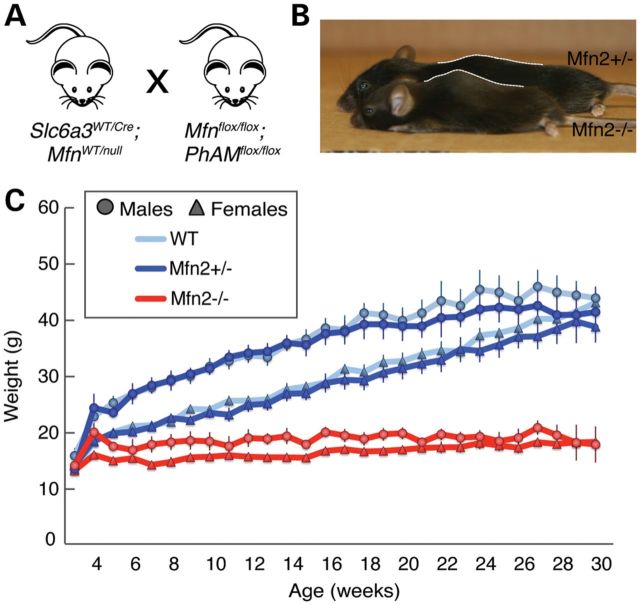
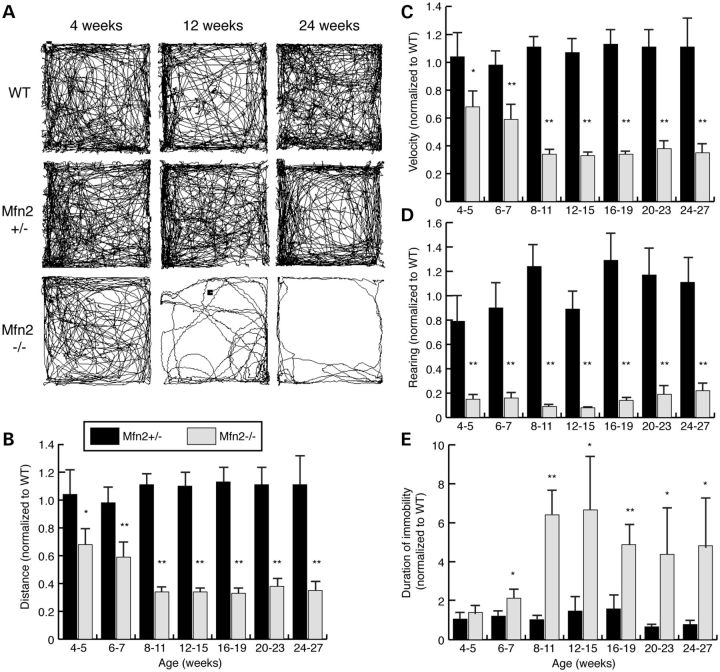
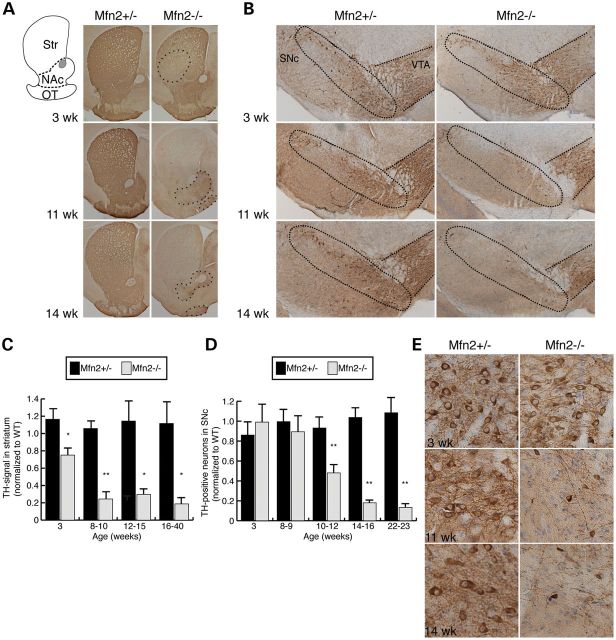
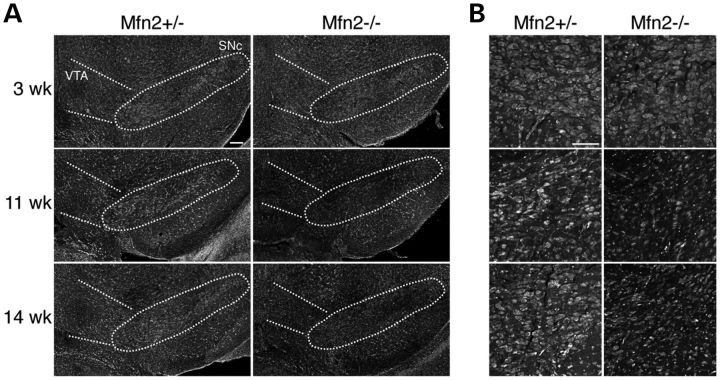
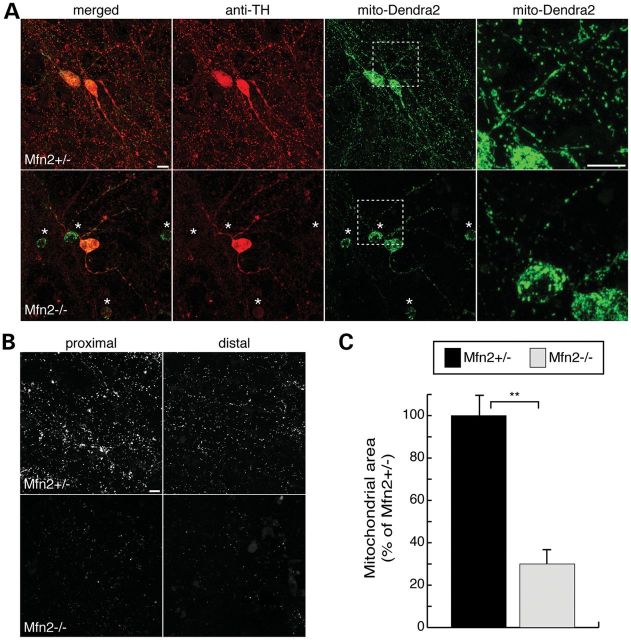
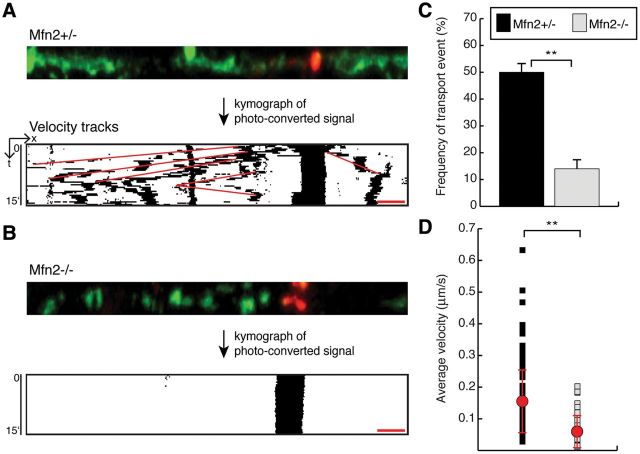
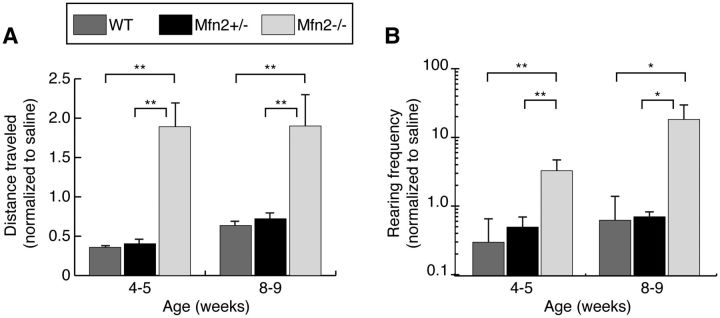
Mitochondria continually undergo fusion and fission, and these dynamic processes play a major role in regulating mitochondrial function. Studies of several genes associated with familial Parkinson's disease (PD) have implicated aberrant mitochondrial dynamics in the disease pathology, but the importance of these processes in dopaminergic neurons remains poorly understood. Because the mitofusins Mfn1 and Mfn2 are essential for mitochondrial fusion, we deleted these genes from a subset of dopaminergic neurons in mice. Loss of Mfn2 results in a movement defect characterized by reduced activity and rearing. In open field tests, Mfn2 mutants show severe, age-dependent motor deficits that can be rescued with L-3,4 dihydroxyphenylalanine. These motor deficits are preceded by the loss of dopaminergic terminals in the striatum. However, the loss of dopaminergic neurons in the midbrain occurs weeks after the onset of these motor and striatal deficits, suggesting a retrograde mode of neurodegeneration. In our conditional knockout strategy, we incorporated a mitochondrially targeted fluorescent reporter to facilitate tracking of mitochondria in the affected neurons. Using an organotypic slice culture system, we detected fragmented mitochondria in the soma and proximal processes of these neurons. In addition, we found markedly reduced mitochondrial mass and transport, which may contribute to the neuronal loss. These effects are specific for Mfn2, as the loss of Mfn1 yielded no corresponding defects in the nigrostriatal circuit. Our findings indicate that perturbations of mitochondrial dynamics can cause nigrostriatal defects and may be a risk factor for the neurodegeneration in PD.
Figures
Similar articles
-
Mitofusin 2 is necessary for striatal axonal projections of midbrain dopamine neurons.Hum Mol Genet. 2012 Nov 15;21(22):4827-35. doi: 10.1093/hmg/dds352. Epub 2012 Aug 21. Hum Mol Genet. 2012. PMID: 22914740
-
Mfn2 protects dopaminergic neurons exposed to paraquat both in vitro and in vivo: Implications for idiopathic Parkinson's disease.Biochim Biophys Acta Mol Basis Dis. 2017 Jun;1863(6):1359-1370. doi: 10.1016/j.bbadis.2017.02.016. Epub 2017 Feb 16. Biochim Biophys Acta Mol Basis Dis. 2017. PMID: 28215578 Free PMC article.
-
Genetic reduction of mitochondrial complex I function does not lead to loss of dopamine neurons in vivo.Neurobiol Aging. 2015 Sep;36(9):2617-27. doi: 10.1016/j.neurobiolaging.2015.05.008. Epub 2015 May 16. Neurobiol Aging. 2015. PMID: 26070241 Free PMC article.
-
Involvement of the Protein Ras Homolog Enriched in the Striatum, Rhes, in Dopaminergic Neurons' Degeneration: Link to Parkinson's Disease.Int J Mol Sci. 2021 May 18;22(10):5326. doi: 10.3390/ijms22105326. Int J Mol Sci. 2021. PMID: 34070217 Free PMC article. Review.
-
Synaptic dysfunction in Parkinson's disease.Adv Exp Med Biol. 2012;970:553-72. doi: 10.1007/978-3-7091-0932-8_24. Adv Exp Med Biol. 2012. PMID: 22351072 Review.
Cited by
-
Neuronal metabolic rewiring promotes resilience to neurodegeneration caused by mitochondrial dysfunction.Sci Adv. 2020 Aug 28;6(35):eaba8271. doi: 10.1126/sciadv.aba8271. eCollection 2020 Aug. Sci Adv. 2020. PMID: 32923630 Free PMC article.
-
Mitochondrial genome linearization is a causative factor for cardiomyopathy in mice and Drosophila.Antioxid Redox Signal. 2014 Nov 10;21(14):1949-59. doi: 10.1089/ars.2013.5432. Epub 2013 Oct 22. Antioxid Redox Signal. 2014. PMID: 23909626 Free PMC article.
-
Environmental neurotoxic pesticide exposure induces gut inflammation and enteric neuronal degeneration by impairing enteric glial mitochondrial function in pesticide models of Parkinson's disease: Potential relevance to gut-brain axis inflammation in Parkinson's disease pathogenesis.Int J Biochem Cell Biol. 2022 Jun;147:106225. doi: 10.1016/j.biocel.2022.106225. Epub 2022 May 12. Int J Biochem Cell Biol. 2022. PMID: 35550926 Free PMC article.
-
Axon degeneration and PGC-1α-mediated protection in a zebrafish model of α-synuclein toxicity.Dis Model Mech. 2014 May;7(5):571-82. doi: 10.1242/dmm.013185. Epub 2014 Mar 13. Dis Model Mech. 2014. PMID: 24626988 Free PMC article.
-
Loss of mitochondrial fission depletes axonal mitochondria in midbrain dopamine neurons.J Neurosci. 2014 Oct 22;34(43):14304-17. doi: 10.1523/JNEUROSCI.0930-14.2014. J Neurosci. 2014. PMID: 25339743 Free PMC article.
References
-
- Schapira A.H., Cooper J.M., Dexter D., Jenner P., Clark J.B., Marsden C.D. Mitochondrial complex I deficiency in Parkinson's disease. Lancet. 1989;1:1269. doi:10.1016/S0140-6736(89)92366-0. - DOI - PubMed
-
- Parker W.D., Jr, Swerdlow R.H. Mitochondrial dysfunction in idiopathic Parkinson disease. Am. J. Hum. Genet. 1998;62:758–762. doi:10.1086/301812. - DOI - PMC - PubMed
-
- Langston J.W., Ballard P., Tetrud J.W., Irwin I. Chronic Parkinsonism in humans due to a product of meperidine-analog synthesis. Science. 1983;219:979–980. doi:10.1126/science.6823561. - DOI - PubMed
-
- Cannon J.R., Greenamyre J.T. Neurotoxic in vivo models of Parkinson's disease recent advances. Prog. Brain Res. 2010;184:17–33. doi:10.1016/S0079-6123(10)84002-6. - DOI - PubMed
-
- Irrcher I., Aleyasin H., Seifert E.L., Hewitt S.J., Chhabra S., Phillips M., Lutz A.K., Rousseaux M.W., Bevilacqua L., Jahani-Asl A., et al. Loss of the Parkinson's disease-linked gene DJ-1 perturbs mitochondrial dynamics. Hum. Mol. Genet. 2010;19:3734–3746. doi:10.1093/hmg/ddq288. - DOI - PubMed
Publication types
MeSH terms
Substances
Grants and funding
LinkOut - more resources
Full Text Sources
Molecular Biology Databases
