Review
. 2012 Oct 4;120(14):2796-806.
doi: 10.1182/blood-2012-04-347286. Epub 2012 Aug 2.

Effect of MHC and non-MHC donor/recipient genetic disparity on the outcome of allogeneic HCT

Affiliations
Review

Effect of MHC and non-MHC donor/recipient genetic disparity on the outcome of allogeneic HCT

Edus H Warren et al. Blood. .

Abstract

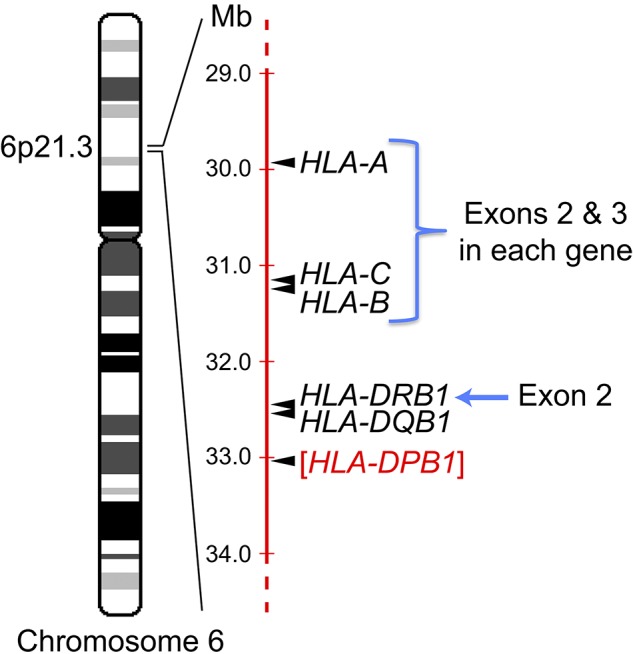
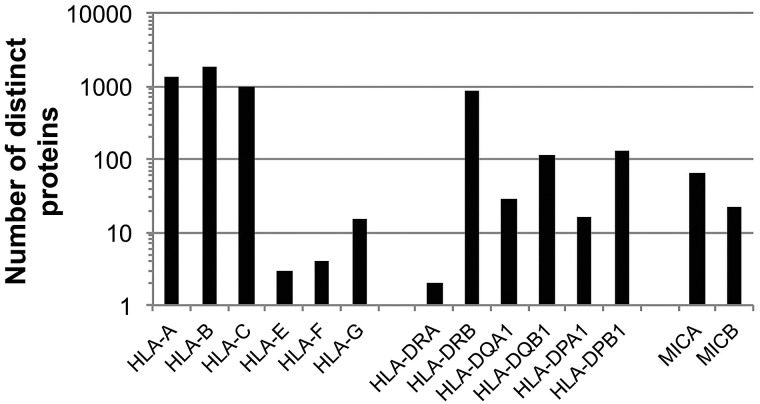
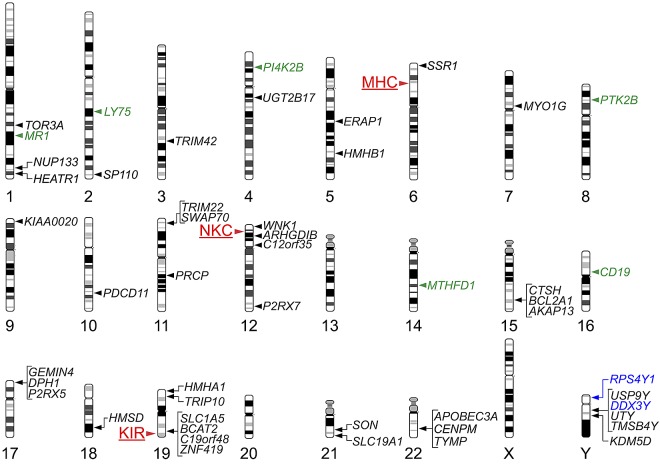
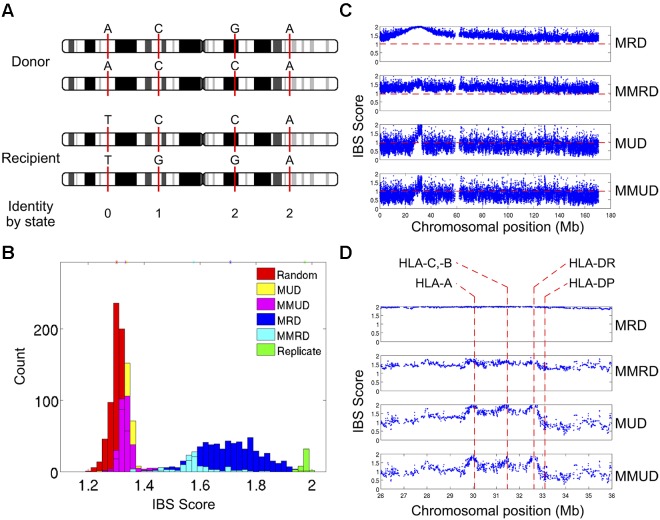
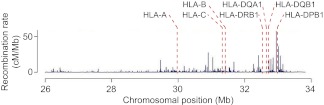
The outcome of allogeneic hematopoietic cell transplantation is influenced by donor/recipient genetic disparity at loci both inside and outside the MHC on chromosome 6p. Although disparity at loci within the MHC is the most important risk factor for the development of severe GVHD, disparity at loci outside the MHC that encode minor histocompatibility (H) antigens can elicit GVHD and GVL activity in donor/recipient pairs who are otherwise genetically identical across the MHC. Minor H antigens are created by sequence and structural variations within the genome. The enormous variation that characterizes the human genome suggests that the total number of minor H loci is probably large and ensures that all donor/recipient pairs, despite selection for identity at the MHC, will be mismatched for many minor H antigens. In addition to mismatch at minor H loci, unrelated donor/recipient pairs exhibit genetic disparity at numerous loci within the MHC, particularly HLA-DP, despite selection for identity at HLA-A, -B, -C, and -DRB1. Disparity at HLA-DP exists in 80% of unrelated pairs and clearly influences the outcome of unrelated hematopoietic cell transplantation; the magnitude of this effect probably exceeds that associated with disparity at any locus outside the MHC.


Figures

Figure 1
Figure 1
Selection of unrelated donors for allogeneic HCT involves sequencing specific exons in 4 different genes on chromosome 6p. The relative position of the HLA-A, HLA-B, HLA-C, and HLA-DRB1 genes in the MHC on the short arm of chromosome 6 at band 6p21.3 is indicated, as are the specific exons within each gene that are routinely sequenced in the process of unrelated donor selection for allogeneic HCT. Most transplantation centers do not as yet perform routine sequencing of exon 2 in the HLA-DQB1 gene, but donor/recipient matching for sequences in this exon is typically performed with medium resolution molecular techniques. The relative position of the HLA-DPB1 gene (in red), which plays a role in histocompatibility in the allogeneic HCT setting but at this time is not routinely sequenced during the donor selection process, is also indicated.
Figure 2
Figure 2
The exons sequenced during the process of donor selection for allogeneic HCT encode critical portions of the peptide-binding grooves of class I and class II MHC molecules. (A) Structure of the extracellular portion of the HLA-A*02:01:01 molecule, indicating the regions encoded by exons 2 (blue), 3 (green), and 4 (red) of the A*02:01:01 allele of the HLA-A gene. (B) Structure of HLA-A*02:01:01 with the peptide VLHDDLLEA, the minor histocompatibility antigen HA-1, bound in its peptide-binding groove. (C) Structure of the extracellular portion of the heterodimeric HLA-DR4 molecule, showing the moieties encoded by exons 2 (light blue) and 3 (red) of the HLA-DRB1 gene, as well as the moiety encoded by exon 2 of the minimally polymorphic HLA-DRA gene (pale yellow). (D) Structure of HLA-DR4 with a peptide derived from influenza hemagglutinin, PKYVKQNTLKLAT, bound in its peptide-binding groove. The HLA-A*02:01:01 and HLA-DR4 structures were derived from Protein Data Bank (PDB) accession nos. 3D25 and 1J8H, and rendered with Pymol.
Figure 3
Figure 3
The HLA-A, -B, -C, and -DRB1 loci are the most polymorphic genes in the entire human genome. The number of distinct HLA-A, -B, -C, -E, -F, -G, -DRA, -DRB1, -DQA1, -DQB1, -DPA1, -DPB1, MICA, and MICB proteins collectively encoded by all known alleles at the corresponding MHC loci is indicated. Data were taken from http://www.ebi.ac.uk/imgt/hla/stats.html; accessed February 13, 2012.
Figure 4
Figure 4
The majority of polymorphic residues that distinguish different alleles of class I and class II molecules are located in positions that influence peptide binding or interaction with T-cell receptors. Structure of HLA-A*02:01:01 without (A) and with (B) the HA-1 minor H antigen bound in its peptide-binding groove, with the regions encoded by exons 2, 3, and 4 of the A*02:01:01 allele of HLA-A colored as in Figure 2. The specific residues in HLA-A*02:01:01 that are nonidentical with those in the HLA-A*03:01:01 molecule are indicated in yellow.
Figure 5
Figure 5
Map of genetic loci that can influence histocompatibility in the allogeneic HCT setting. The chromosomal location of the MHC, and of 2 other multigene clusters, the NKC and the KIR locus, are indicated by red labels and arrowheads to the left of the corresponding chromosomes. The chromosomal locations of genes that have been shown to encode T lymphocyte–defined minor H antigens are indicated by labels and arrowheads to the right of the corresponding chromosomes; genes that encode class I MHC-restricted minor H antigens recognized by CD8+ T cells are indicated by black labels, those that encode class II MHC-restricted minor H antigens recognized by CD4+ T cells are indicated by green labels, and those that encode both class I and class II MHC-restricted minor H antigens are indicated by blue labels.
Figure 6
Figure 6
Expected donor/recipient disparity at a hypothetical locus encoding a minor histocompatibility antigen is a function of the frequency of the antigenic allele and, for any given frequency of the antigenic allele, is greater for unrelated than for sibling donor/recipient pairs. Adapted from Martin.
Figure 7
Figure 7
SNP genotyping with the use of high-density DNA arrays shows the fine structure of donor-recipient genetic identity both within and outside the MHC. (A) Definition of the concept of donor/recipient genetic identity by state (IBS). The genotypes of a hypothetical HCT donor/recipient pair at 4 SNPs located in different intervals on chromosome 1 are indicated by the letters above the corresponding positions on the donor and recipient chromosomes; the IBS score between donor and recipient at each of the 4 SNPs (either 0, 1, or 2 alleles shared) is indicated at the bottom of the panel immediately below the position of each SNP. (B) Distribution of the average IBS across 14 098 SNPs, all with minor allele frequency ≥ 0.2, on chromosome 6 for 1378 HCT donor/recipient pairs who received a transplant at the Fred Hutchinson Cancer Research Center between 1992 and 2004; genotypes were determined with the Affymetrix Human SNP 5.0 chip. The transplant pairs were classified as matched related donor (MRD; n = 595), mismatched related donor (MMRD; n = 122), matched unrelated donor (MUD; n = 347), or mismatched unrelated (MMUD; n = 302) pairs based on their relationship to one another and on their degree of HLA matching, as determined by sequencing of their HLA-A, -B, -C, -DRB1, and -DQB1 alleles (matched, 10 of 10 alleles; mismatched, < 10 of 10 alleles). The distribution of average IBS across the same 14 098 SNPs between 661 randomly selected pairs of persons in the cohort and between replicate genotypes for 45 persons is also shown. (C) The haplotype-based IBS in a sliding window of 7 adjacent SNPs calculated for all 26 814 SNPs on chromosome 6 with < 10% missing genotypes is plotted for the MRD, MMRD, MUD, and MMUD donor/recipient pairs. The haplotype-based IBS in a window of SNPs is the statistical expectation of the number of haplotypes shared by the donor and recipient, given their unphased SNP genotypes within that interval. (D) Magnified view of the haplotype-based IBS data from panel C for all of the SNPs in a 10-Mb interval on chromosome 6p that spans the entire MHC. The location of the HLA-A, -C, -B, -DRB1, and -DQB1 genes is indicated by the dashed vertical red lines.
Figure 8
Figure 8
Weak linkage between the HLA-DP loci and the class I and telomeric portion of the class II regions of the MHC is primarily attributable to hot spots of recombination that lie just telomeric of HLA-DP. Map of observed recombination rate within an 8-Mb interval of chromosome 6p that spans the classic MHC. Adapted from de Bakker et al with permission.

References

    1. Thomas E, Storb R, Clift RA, et al. Bone-marrow transplantation (first of two parts). N Engl J Med. 1975;292(16):832–843. - PubMed
    1. Thomas ED, Storb R, Clift RA, et al. Bone-marrow transplantation (second of two parts). N Engl J Med. 1975;292(17):895–902. - PubMed
    1. Bleakley M, Riddell SR. Exploiting T cells specific for human minor histocompatibility antigens for therapy of leukemia. Immunol Cell Biol. 2011;89(3):396–407. - PMC - PubMed
    1. Bray RA, Hurley CK, Kamani NR, et al. National marrow donor program HLA matching guidelines for unrelated adult donor hematopoietic cell transplants. Biol Blood Marrow Transplant. 2008;14(9 Suppl):45–53. - PubMed
    1. Bjorkman PJ, Saper MA, Samraoui B, Bennett WS, Strominger JL, Wiley DC. Structure of the human class I histocompatibility antigen, HLA-A2. Nature. 1987;329(6139):506–512. - PubMed

Publication types

MeSH terms