

The effect of low glucose degradation product, neutral pH versus standard peritoneal dialysis solutions on peritoneal membrane function: the balANZ trial
- PMID: 22859794
- PMCID: PMC3520083
- DOI: 10.1093/ndt/gfs314
The effect of low glucose degradation product, neutral pH versus standard peritoneal dialysis solutions on peritoneal membrane function: the balANZ trial
Abstract
Background: The balANZ trial recently reported that neutral pH, low glucose degradation product (biocompatible) peritoneal dialysis (PD) solutions significantly delayed anuria and reduced peritonitis rates compared with conventional solutions. This article reports a secondary outcome analysis of the balANZ trial with respect to peritoneal membrane function.
Methods: Adult, incident PD patients with residual renal function were randomized to receive either biocompatible or conventional (control) PD solutions for 2 years. Peritoneal equilibration tests were performed at 1, 6, 12, 18 and 24 months. Peritoneal small solute clearances and ultra-filtration (UF) were measured at 3, 6, 9, 12, 18 and 24 months.
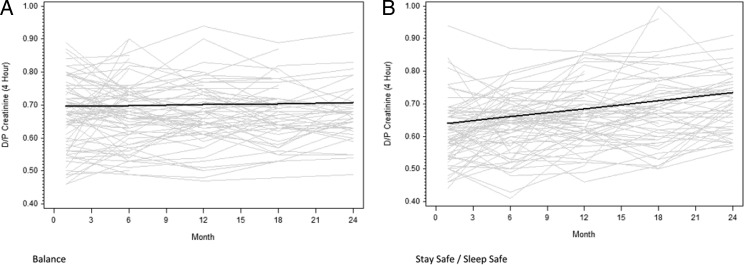
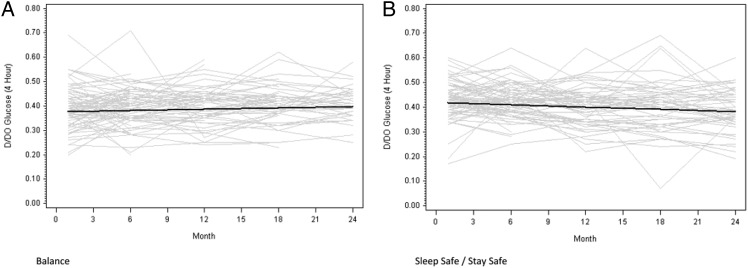
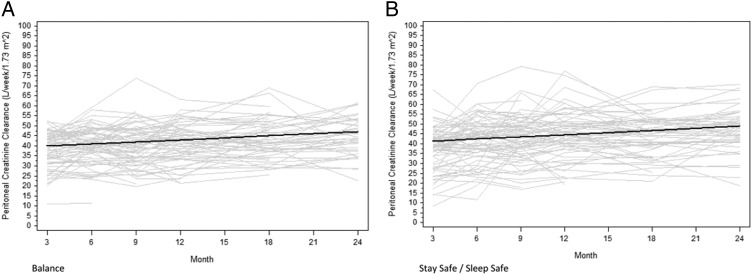
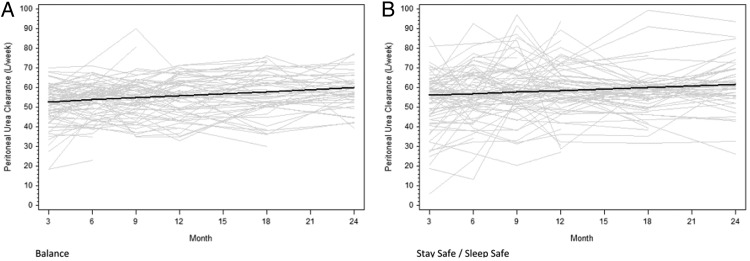
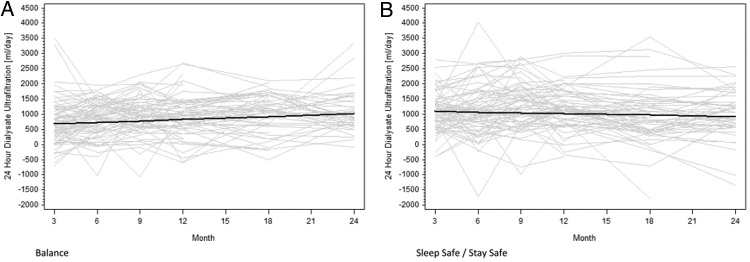
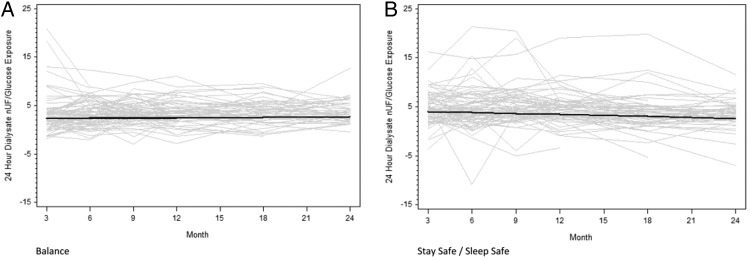
Results: Of the 185 patients recruited into the trial, 85 patients in the Balance group and 82 patients in the control group had peritoneal membrane function evaluated. Mean 4-h dialysate:plasma creatinine ratios (D:P Cr 4h) at 1 month were significantly higher in the Balance group compared with controls (0.67 ± 0.10 versus 0.62 ± 0.10, P = 0.002). Over the 2-year study period, mean D:P Cr 4 h measurements remained stable in the Balance group but increased significantly in controls [difference -0.004 per month, 95% confidence interval (95% CI) -0.005 to -0.002, P < 0.001]. Similar results were obtained for dialysate glucose ratios (D/D0 glucose). Peritoneal UF was significantly lower in the Balance group than in controls at 3 and 6 months. Over the 2-year study period, peritoneal UF increased significantly in the Balance group but remained stable in controls (difference 24 mL/day/month, 95% CI 9-39, P = 0.002). No differences in peritoneal small solute clearances, prescribed dialysate fill volumes or peritoneal glucose exposure were observed between the two groups.
Conclusions: Biocompatible and conventional PD solutions exert differential effects on peritoneal small solute transport rate and UF over time. Adequately powered trials assessing the impact of these differential membrane effects on PD technique and patient survival rates are warranted.
Figures
References
-
- Serkes KD, Blagg CR, Nolph KD, et al. Comparison of patient and technique survival in continuous ambulatory peritoneal dialysis (CAPD) and hemodialysis: a multicenter study. Perit Dial Int. 1990;10:15–19. - PubMed
-
- Vonesh EF, Moran J. Mortality in end-stage renal disease: a reassessment of differences between patients treated with hemodialysis and peritoneal dialysis. J Am Soc Nephrol. 1999;10:354–365. - PubMed
-
- Fenton SS, Schaubel DE, Desmeules M, et al. Hemodialysis versus peritoneal dialysis: a comparison of adjusted mortality rates [see comments] Am J Kidney Dis. 1997;30:334–342. doi:10.1016/S0272-6386(97)90276-6. - DOI - PubMed
-
- Tanna MM, Vonesh EF, Korbet SM. Patient survival among incident peritoneal dialysis and hemodialysis patients in an urban setting. Am J Kidney Dis. 2000;36:1175–1182. doi:10.1053/ajkd.2000.19832. - DOI - PubMed
Publication types
MeSH terms
Substances
LinkOut - more resources
Full Text Sources
Other Literature Sources
