. 2012 Sep;23(9):1538-50.
doi: 10.1681/ASN.2012020137. Epub 2012 Aug 2.

Activation of parenchymal CD47 promotes renal ischemia-reperfusion injury

Affiliations

Activation of parenchymal CD47 promotes renal ischemia-reperfusion injury

Natasha M Rogers et al. J Am Soc Nephrol. 2012 Sep.

Abstract

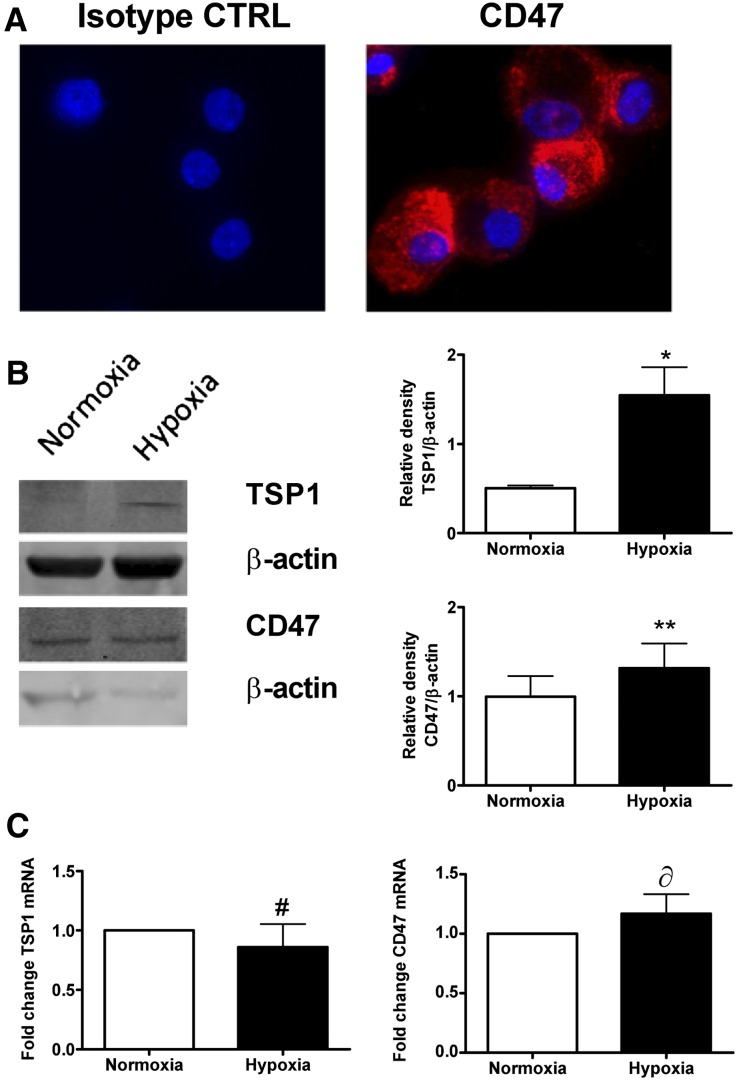
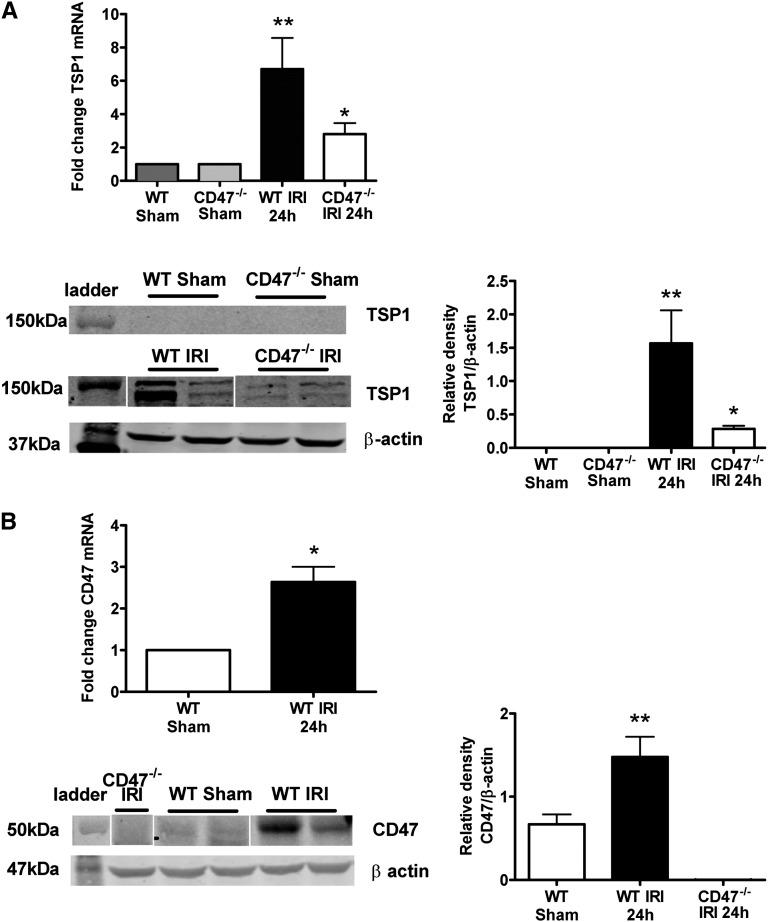
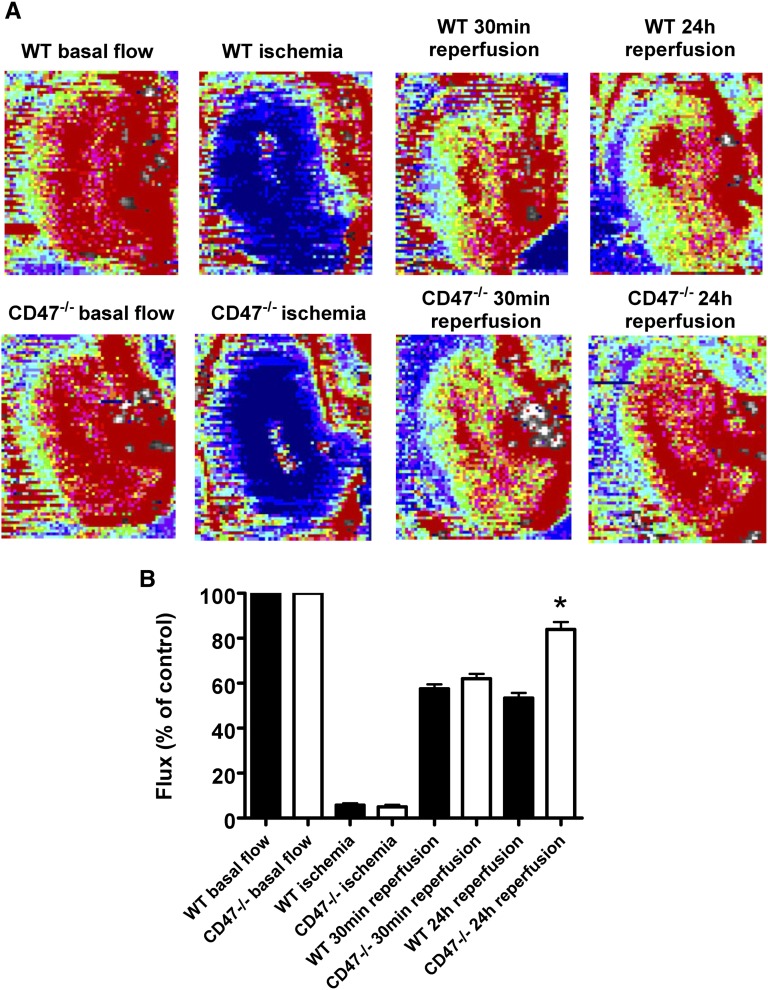
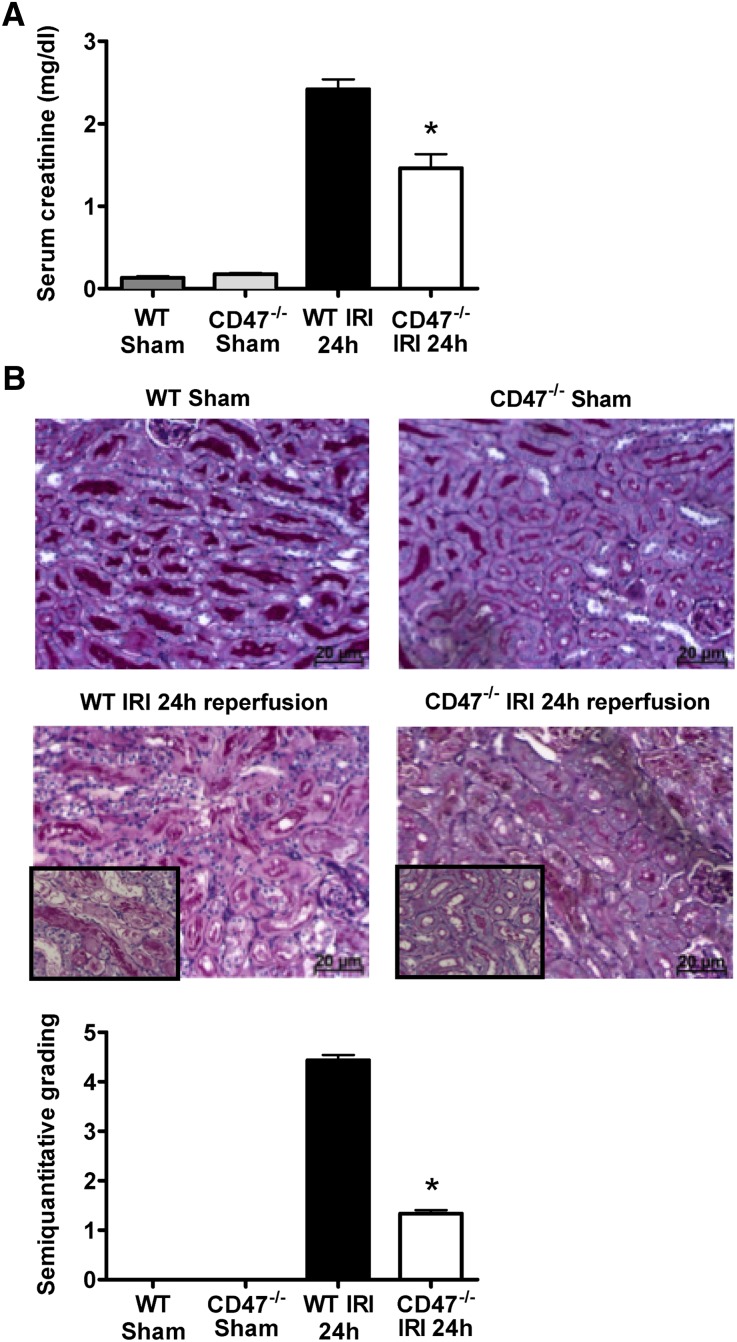
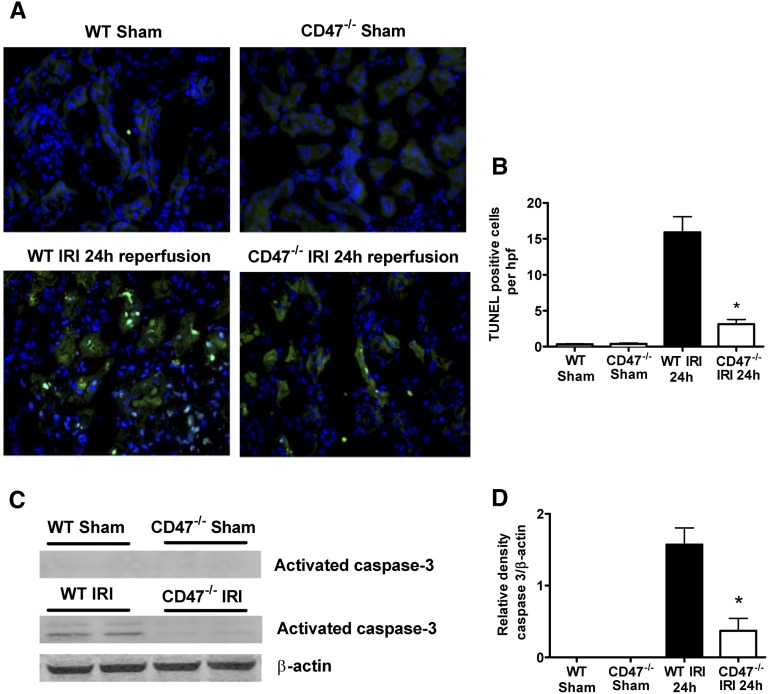
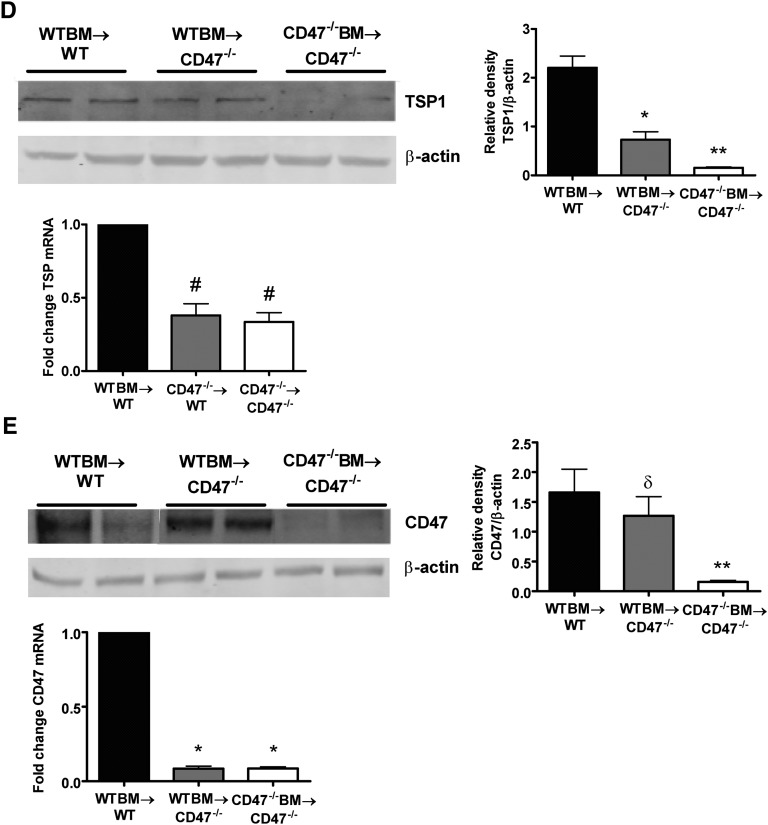
Ischemia-reperfusion injury (IRI) contributes to decreased allograft function and allograft rejection in transplanted kidneys. Thrombospondin-1 is a stress protein typically secreted in response to hypoxia and the ligand activator for the ubiquitously expressed receptor CD47. The function of activated CD47 in IRI remains completely unknown. Here, we found that both CD47 and its ligand thrombospondin-1 were upregulated after renal IRI in mice. CD47-knockout mice were protected against renal dysfunction and tubular damage, suggesting that the development of IRI requires intact CD47 signaling. Chimeric CD47-knockout mice engrafted with wild-type hematopoietic cells had significantly lower serum creatinine and less tubular damage than wild-type controls after IRI, suggesting that CD47 signaling in parenchymal cells predominantly mediates renal damage. Treatment with a CD47-blocking antibody protected mice from renal dysfunction and tubular damage compared with an isotype control. Taken together, these data imply that CD47 on parenchymal cells promotes injury after renal ischemia and reperfusion. Therefore, CD47 blockade may have therapeutic potential to prevent or suppress ischemia-reperfusion-mediated damage.


Figures

Figure 1.
Figure 1.
RTECs express CD47 and upregulate TSP1 in response to hypoxia. (A) Human RTECs were stained with CD47 antibody or isotype control (CTRL) and visualized by confocal microscopy. RTECs were exposed to 30-minute hypoxia (FiO2 1%) and then 24-hour reoxygenation or normoxia alone and TSP1 and CD47 (B) protein and (C) mRNA assessed. Data shown are means ± SD, and representative Western blots with relative densities are calculated from n=4 experiments. *P<0.01; **P=0.49; #P=0.88; δP=0.38 normoxia versus hypoxia.
Figure 2.
Figure 2.
Renal IRI upregulates CD47 and its ligand TSP1. Kidney lysate from WT C57BL/6 male mice 24 hours after IRI compared with sham-operated controls was prepared and (A) TSP1 mRNA and protein (TSP1 is detected at 150 kD) or (B) CD47 mRNA and protein expression (CD47 is detected at 47–52 kD) assessed. mRNA data shown are mean ± SD, n=8 mice per group with the WT sham-operated animals as the reference group; representative Western blots with relative densities calculated from n=4 mice per group. *P<0.001 CD47−/− after IRI versus WT after IRI; **P<0.001 WT sham versus WT after IRI.
Figure 3.
Figure 3.
Renal reperfusion is limited by CD47. Eight-week-old male C57BL/6 WT and CD47−/− mice underwent 22 minutes of left-sided renal pedicle occlusion followed by reperfusion. (A) Representative laser Doppler color images of renal blood flow at baseline, ischemia, 30 minutes, and 24 hours of reperfusion. Red coloration of images indicates maximum blood flow and blue coloration minimum blood flow. (B) Analysis of tissue blood flow was performed. Changes in renal perfusion at indicated time points are presented as flux normalized to baseline values (% control). Results represent the mean ± SD of four measurements at each time point from n=5 WT and n=5 CD47−/− mice. *P<0.001 CD47−/− versus WT at 24 hours of reperfusion.
Figure 4.
Figure 4.
CD47−/− mice are protected against severe renal IRI. (A) Quantification of serum creatinine after bilateral renal ischemia and 24 hours reperfusion, in CD47−/− mice (white bars), WT controls (black bars), and sham-operated mice (gray bars). Data are mean ±SD, n=8–10 per group. *P<0.001 CD47−/− versus WT. (B) Representative renal tissue sections and quantitative analysis of tubular damage of corticomedulla from WT and CD47−/− mice 24 hours after sham operation or ischemia-reperfusion (periodic acid–Schiff stained) are shown. Data shown are mean ± SD, n=8–10 per group, *P<0.001 CD47−/− after IRI versus WT after IRI. Original magnification, ×200; inset, ×400 magnification insert.
Figure 5.
Figure 5.
Inflammatory cell infiltration is significantly decreased in CD47−/− mice subjected to renal IRI. Representative photomicrographs and quantitative analysis of kidney tissue sections stained by immunohistochemistry for (A) neutrophils and (B) macrophages (total cell number per 10 hpf for both parameters). Data shown are mean ± SD, n=8–10 per group. *P=0.001 and **P<0.05 CD47−/− after IRI versus WT after IRI. Original magnification, ×400.
Figure 6.
Figure 6.
Proinflammatory cytokine and chemokine mRNA profiles are reduced in CD47−/− mice subjected to renal IRI. mRNA expression of proinflammatory cytokines IL-6, TNFα, and IL-1β and CCL2 and CXCL2 in kidneys from WT and CD47−/− mice subjected to IRI. Results have been normalized to the housekeeping gene (HPRT1) and WT sham-operated animals used as the reference group. Data shown are means ± SD, n=6–10 per group. *P<0.001 CD47−/− after IRI versus WT after IRI; #P=0.01 CD47−/− after IRI versus WT after IRI.
Figure 7.
Figure 7.
Programmed cell death and apoptosis are reduced in the kidney in CD47−/− mice after IRI. (A) Representative renal tissue sections from IRI and sham-operated mice (n=6 per group) were stained by TUNEL assay and visualized by confocal microscopy. (B) Apoptotic cells/hpf were counted in 10 successive fields in CD47−/− mice (white bars) and WT mice (black bars). *P<0.001 CD47−/− after IRI versus wild-type after IRI. (C) Kidney tissue lysate was prepared from WT or CD47−/− mice subjected to sham operation or IRI, resolved by SDS-PAGE and probed for caspase-3 (activated caspase-3 is detected at 17 and 19 kD). Densitometry represents mean ±SD of n=6 samples per group (D). *P<0.001 CD47−/− after IRI versus WT after IRI. Original magnification, ×200.
Figure 8.
Figure 8.
Renal oxidative stress is reduced in CD47−/− mice after IRI. (A) Representative renal tissue sections from IRI and sham-operated mice (n=6–8 per group) stained with DHE and visualized by confocal microscopy. Intensity of staining was quantified using Image J. *P<0.001 CD47−/− after IRI versus WT after IRI. (B) Kidney tissue lysate was prepared from WT or CD47−/− mice subjected to sham operation or IRI, resolved by SDS-PAGE, and probed for 3-nitrotyrosine (3NT). Densitometry represents mean ± SD of n=4 samples per group. *P<0.001 CD47−/− after IRI versus WT after IRI. (C) mRNA expression profile of iNOS in renal tissue in WT and CD47−/− mice subjected to IRI or sham operation. Results have been normalized to the housekeeping gene (HPRT1) and WT sham-operated animals used as the reference group. Data shown are mean ± SD, n=6–10 per group. *P<0.001 CD47−/− after IRI versus WT after IRI. Original magnification, ×200.
Figure 9.
Figure 9.
Expression of parenchymal activated CD47 determines kidney damage after IRI. (A) Donor recipient chimerism of the hematopoietic system 8 weeks after BM transplantation in wild-type and CD47−/− mice. Whole blood collected from CD47−/− mice transplanted with WT BM were subjected to FACS analysis of CD47 expression and compared with relevant control groups. Analysis of (B) serum creatinine and (C) tubular damage in respective BM chimeric mice at 24 hours reperfusion after bilateral renal ischemia. Data are mean ± SEM, n=6–7 per group. *P<0.001 WTBM→WT versus WTBM→CD47−/− and CD47−/−BM→CD47−/−. Kidney tissue lysate was prepared from chimeric mice and (D) TSP1 and (E) CD47 protein and mRNA assessed. Data are mean ± SEM, n=6 per group. *P<0.01 WTBM→WT versus WTBM→CD47−/−; **P=0.001 WTBM→CD47−/− versus CD47−/−BM→CD47−/−; #P<0.0001 compared with WTBM→WT; δP=0.45 WTBM→WT versus WTBM→CD47−/−.
Figure 9.
Figure 9.
Expression of parenchymal activated CD47 determines kidney damage after IRI. (A) Donor recipient chimerism of the hematopoietic system 8 weeks after BM transplantation in wild-type and CD47−/− mice. Whole blood collected from CD47−/− mice transplanted with WT BM were subjected to FACS analysis of CD47 expression and compared with relevant control groups. Analysis of (B) serum creatinine and (C) tubular damage in respective BM chimeric mice at 24 hours reperfusion after bilateral renal ischemia. Data are mean ± SEM, n=6–7 per group. *P<0.001 WTBM→WT versus WTBM→CD47−/− and CD47−/−BM→CD47−/−. Kidney tissue lysate was prepared from chimeric mice and (D) TSP1 and (E) CD47 protein and mRNA assessed. Data are mean ± SEM, n=6 per group. *P<0.01 WTBM→WT versus WTBM→CD47−/−; **P=0.001 WTBM→CD47−/− versus CD47−/−BM→CD47−/−; #P<0.0001 compared with WTBM→WT; δP=0.45 WTBM→WT versus WTBM→CD47−/−.
Figure 10.
Figure 10.
Antibody blockade of CD47 significantly ameliorates renal IRI. WT mice were treated with CD47 blocking antibody (αCD47) or isotype IgG control (CTRL) antibody (0.4 μg/g body weight) 90 minutes before induction of IRI. (A) Sham-operated kidneys were sectioned, stained with anti-rat AlexaFluor-555, and visualized by confocal microscopy. Representative images are shown. (B) Western blots of kidney tissue lysates were probed for TSP1 and CD47. Densitometry represents mean ± SD of n=4 samples per group. *P<0.001 WT + αCD47 antibody after IRI versus WT + CTRL antibody after IRI. (C) Levels of serum creatinine, and (D) quantitative analysis of tubular damage with representative renal tissue sections of corticomedulla from treatment groups 24 hours after ischemia-reperfusion are shown. Data are mean ± SD, n=10–12 per group. *P<0.001 and **P<0.0001 WT + αCD47 antibody after IRI versus WT + CTRL antibody after IRI. (E) Representative photomicrographs and quantitative analysis of kidney tissue sections stained by immunohistochemistry for neutrophils (total cell number per 10 hpf). Data shown are mean ±SD, n=6 per group and six independent fields assessed. (F) mRNA expression of proinflammatory cytokines IL-6, TNFα, and IL-1β, chemokines CCL2 and CXCL2, and iNOS in kidneys from WT mice pretreated with CTRL or αCD47 antibody and subjected to IRI. Results have been normalized to the housekeeping gene (HPRT1) and WT CTRL antibody animals used as the referent control. Data shown are mean ± SD, n=7 per group. **P<0.0001; P=0.90; #P=0.02. Original magnification, ×400 in A and E; ×200 in C.
Figure 10.
Figure 10.
Antibody blockade of CD47 significantly ameliorates renal IRI. WT mice were treated with CD47 blocking antibody (αCD47) or isotype IgG control (CTRL) antibody (0.4 μg/g body weight) 90 minutes before induction of IRI. (A) Sham-operated kidneys were sectioned, stained with anti-rat AlexaFluor-555, and visualized by confocal microscopy. Representative images are shown. (B) Western blots of kidney tissue lysates were probed for TSP1 and CD47. Densitometry represents mean ± SD of n=4 samples per group. *P<0.001 WT + αCD47 antibody after IRI versus WT + CTRL antibody after IRI. (C) Levels of serum creatinine, and (D) quantitative analysis of tubular damage with representative renal tissue sections of corticomedulla from treatment groups 24 hours after ischemia-reperfusion are shown. Data are mean ± SD, n=10–12 per group. *P<0.001 and **P<0.0001 WT + αCD47 antibody after IRI versus WT + CTRL antibody after IRI. (E) Representative photomicrographs and quantitative analysis of kidney tissue sections stained by immunohistochemistry for neutrophils (total cell number per 10 hpf). Data shown are mean ±SD, n=6 per group and six independent fields assessed. (F) mRNA expression of proinflammatory cytokines IL-6, TNFα, and IL-1β, chemokines CCL2 and CXCL2, and iNOS in kidneys from WT mice pretreated with CTRL or αCD47 antibody and subjected to IRI. Results have been normalized to the housekeeping gene (HPRT1) and WT CTRL antibody animals used as the referent control. Data shown are mean ± SD, n=7 per group. **P<0.0001; P=0.90; #P=0.02. Original magnification, ×400 in A and E; ×200 in C.

References

    1. Halloran PF, Homik J, Goes N, Lui SL, Urmson J, Ramassar V, Cockfield SM: The “injury response”: A concept linking nonspecific injury, acute rejection, and long-term transplant outcomes. Transplant Proc 29: 79–81, 1997 - PubMed
    1. Hetzel GR, Klein B, Brause M, Westhoff A, Willers R, Sandmann W, Grabensee B: Risk factors for delayed graft function after renal transplantation and their significance for long-term clinical outcome. Transpl Int 15: 10–16, 2002 - PubMed
    1. Shoskes DA, Halloran PF: Delayed graft function in renal transplantation: Etiology, management and long-term significance. J Urol 155: 1831–1840, 1996 - PubMed
    1. Murillo D, Kamga C, Mo L, Shiva S: Nitrite as a mediator of ischemic preconditioning and cytoprotection. Nitric Oxide 25: 70–80, 2011 - PMC - PubMed
    1. Smadja DM, d’Audigier C, Bièche I, Evrard S, Mauge L, Dias JV, Labreuche J, Laurendeau I, Marsac B, Dizier B, Wagner-Ballon O, Boisson-Vidal C, Morandi V, Duong-Van-Huyen JP, Bruneval P, Dignat-George F, Emmerich J, Gaussem P: Thrombospondin-1 is a plasmatic marker of peripheral arterial disease that modulates endothelial progenitor cell angiogenic properties. Arterioscler Thromb Vasc Biol 31: 551–559, 2011 - PubMed

Publication types

MeSH terms