

Risk of venous thromboembolism in patients with cancer: a systematic review and meta-analysis
- PMID: 22859911
- PMCID: PMC3409130
- DOI: 10.1371/journal.pmed.1001275
Risk of venous thromboembolism in patients with cancer: a systematic review and meta-analysis
Abstract
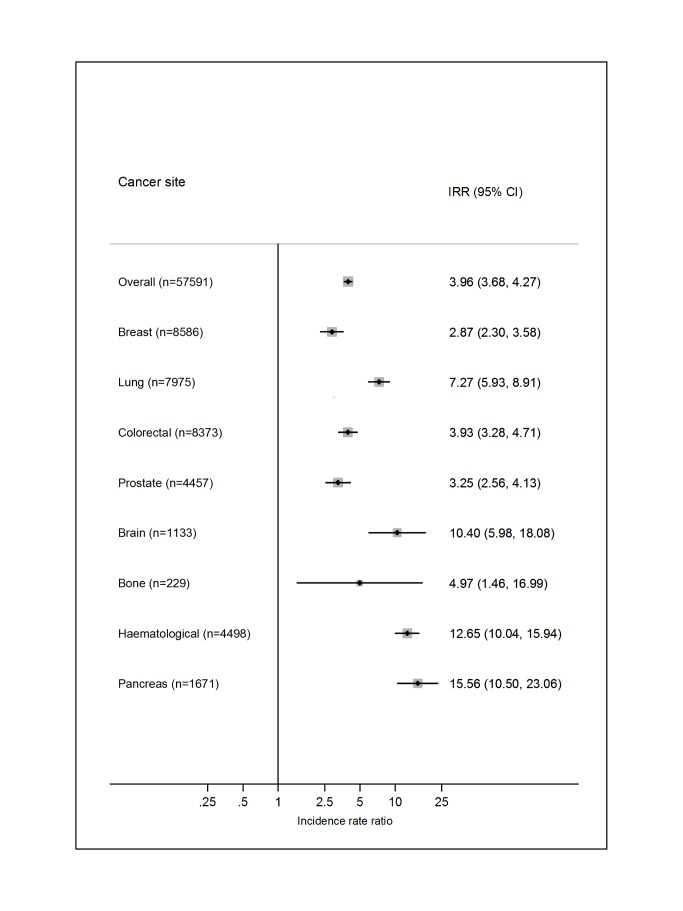
Background: People with cancer are known to be at increased risk of venous thromboembolism (VTE), and this risk is believed to vary according to cancer type, stage of disease, and treatment modality. Our purpose was to summarise the existing literature to determine precisely and accurately the absolute risk of VTE in cancer patients, stratified by malignancy site and background risk of VTE.
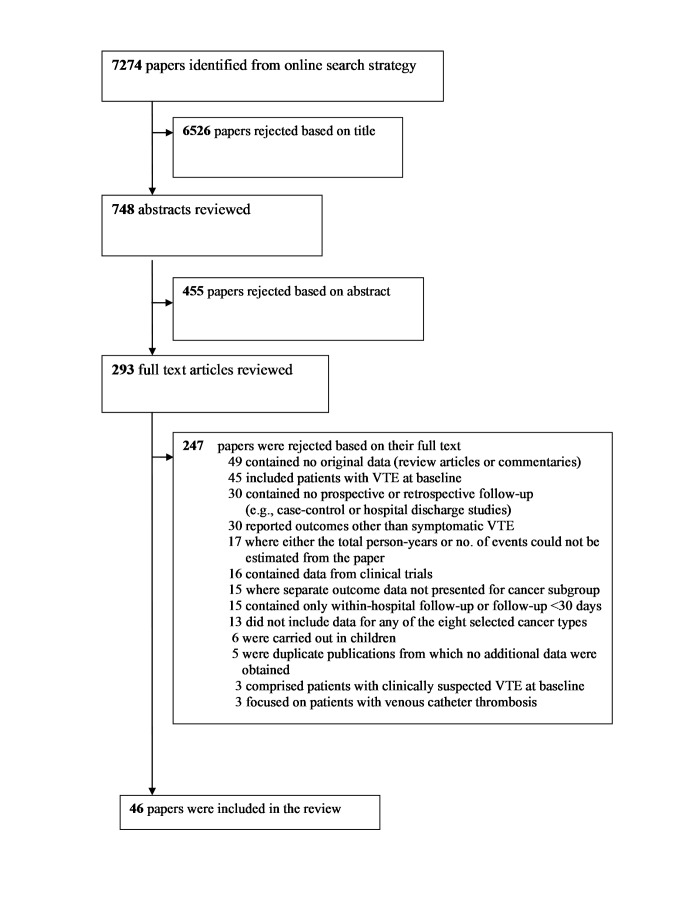
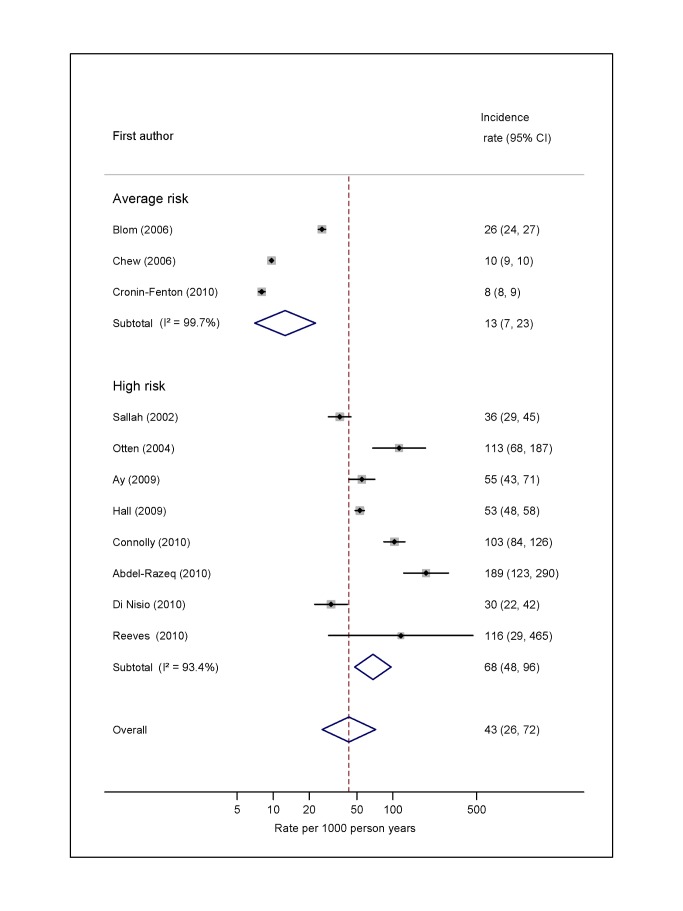
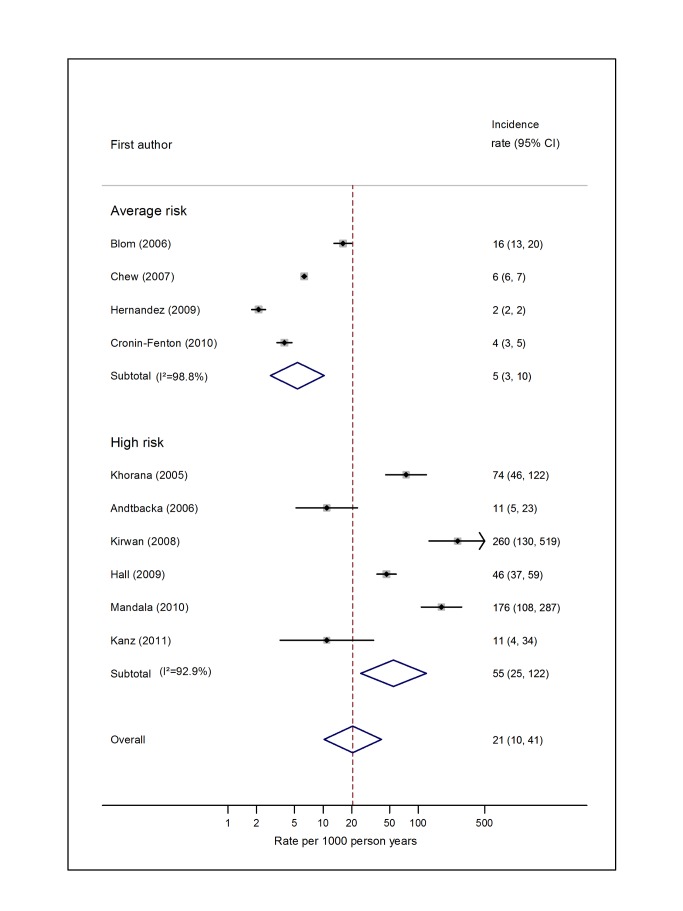
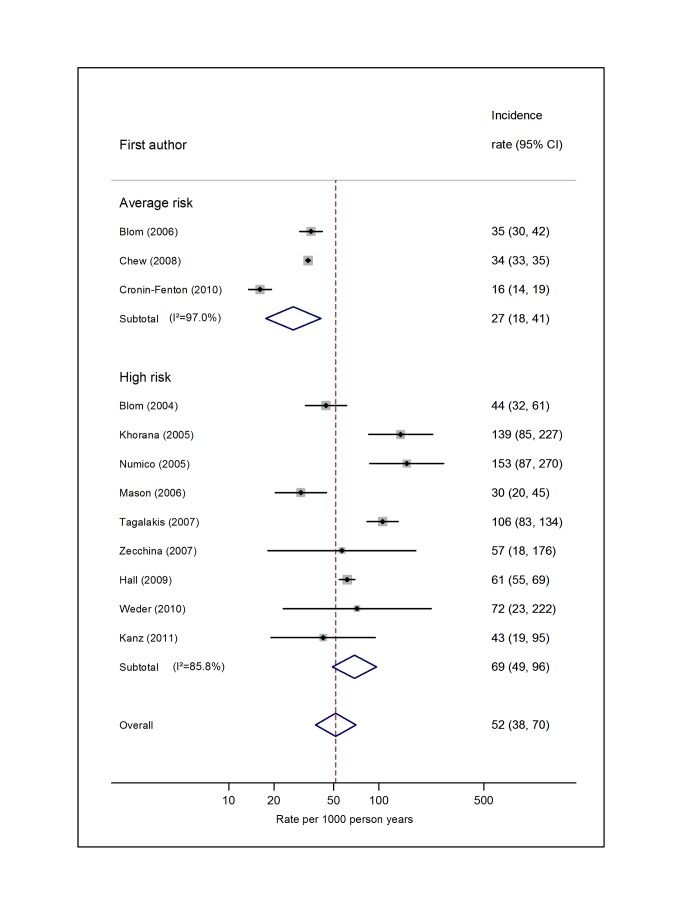
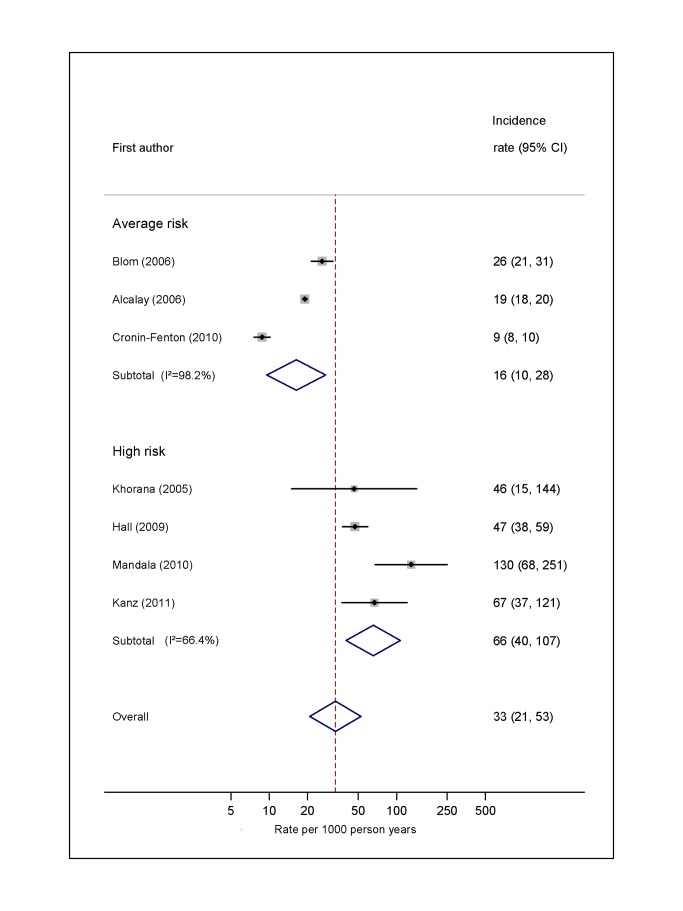
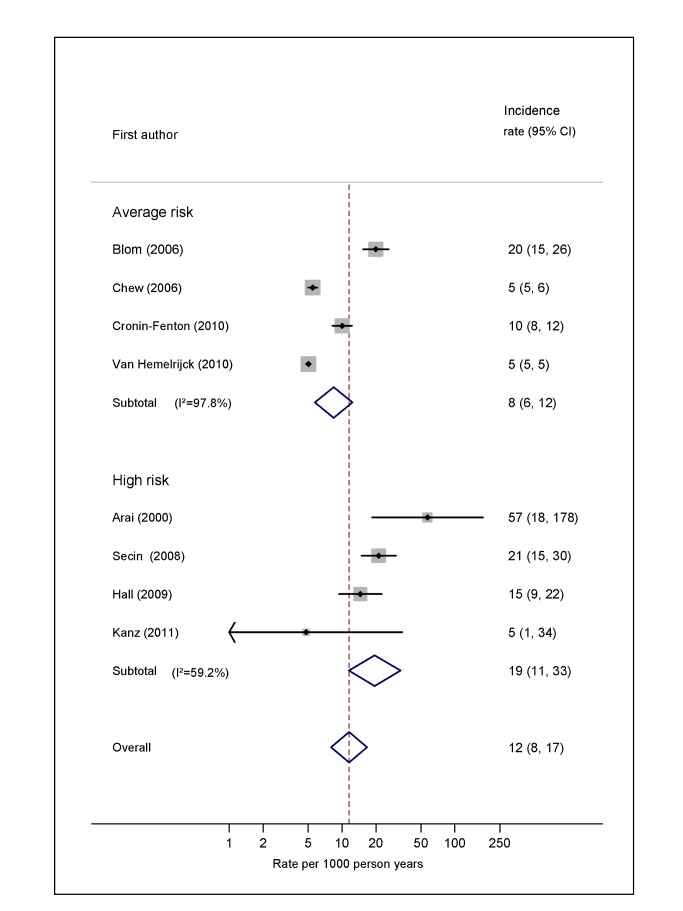
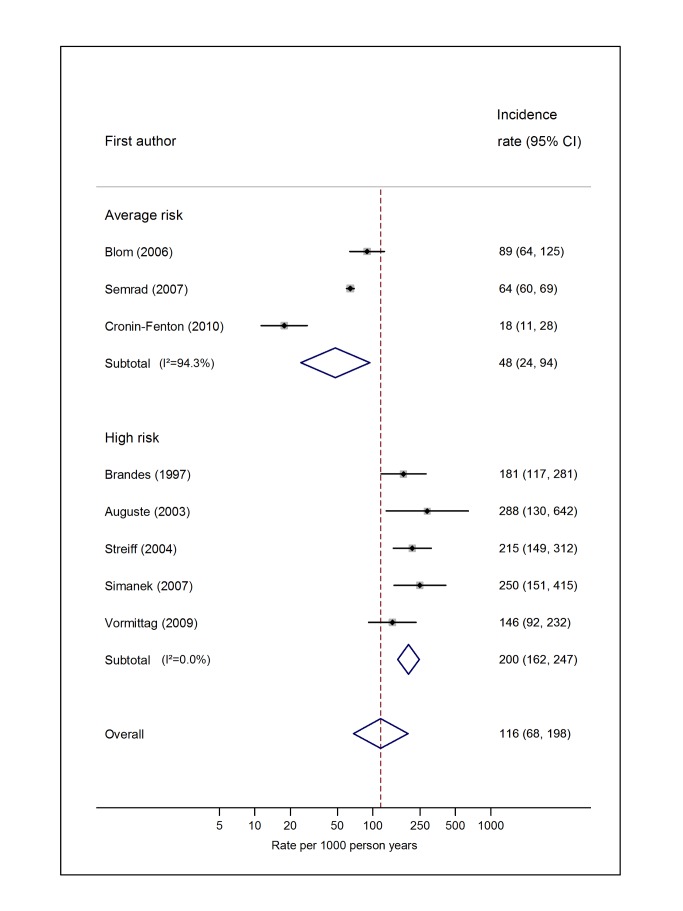
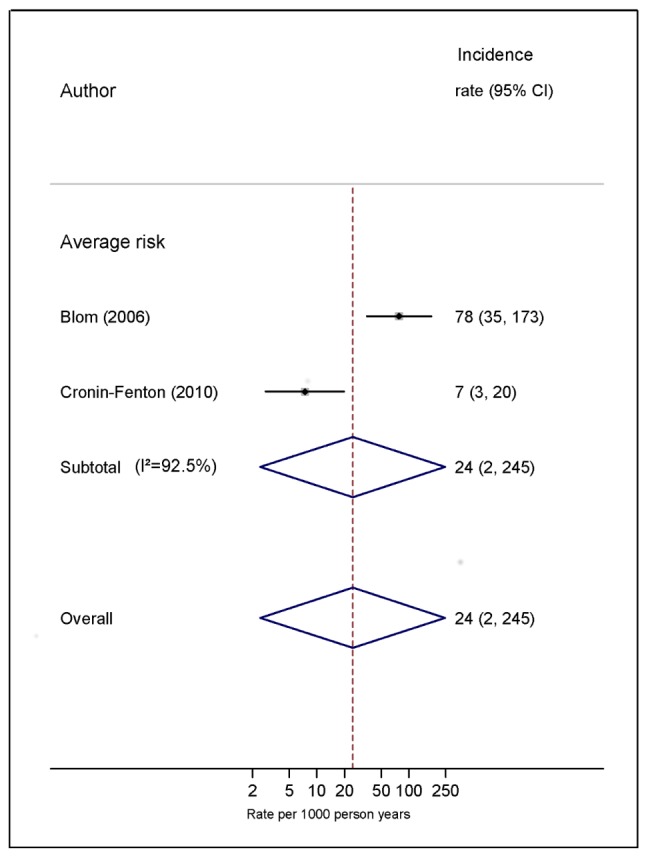
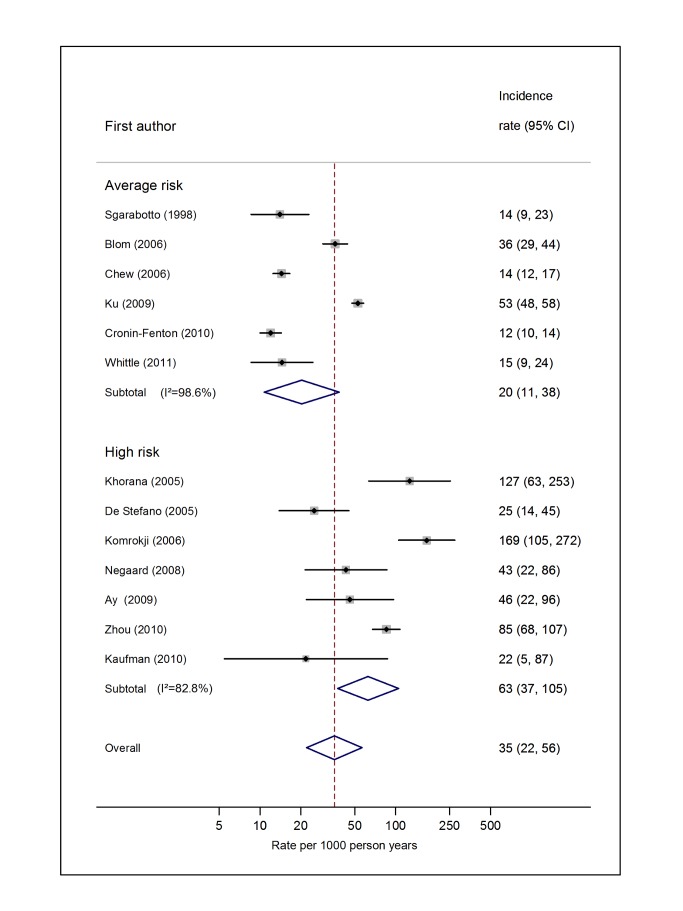
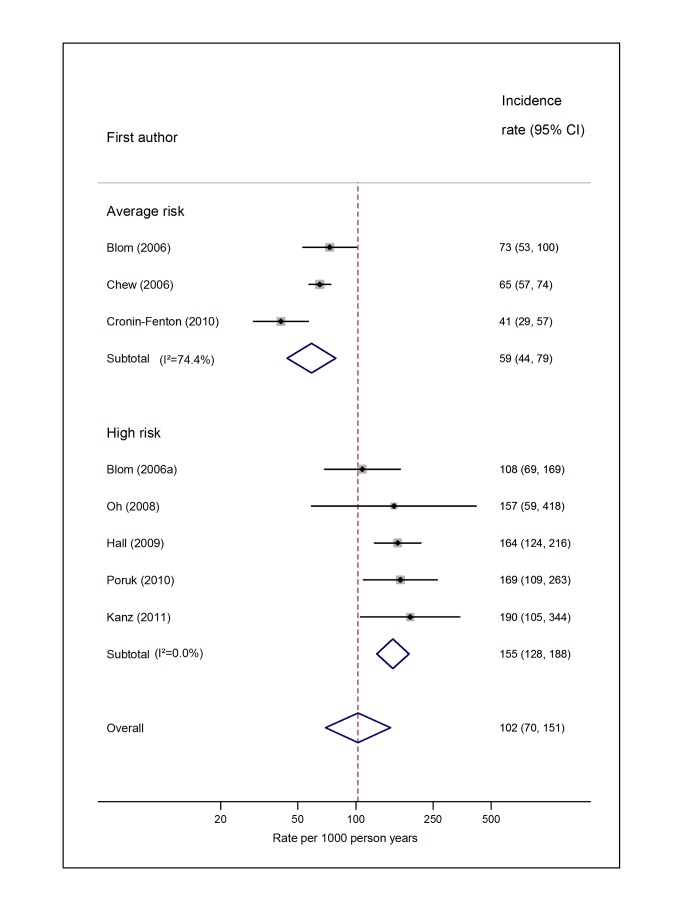
Methods and findings: We searched the Medline and Embase databases from 1 January 1966 to 14 July 2011 to identify cohort studies comprising people diagnosed with one of eight specified cancer types or where participants were judged to be representative of all people with cancer. For each included study, the number of patients who developed clinically apparent VTE, and the total person-years of follow-up were extracted. Incidence rates of VTE were pooled across studies using the generic inverse variance method. In total, data from 38 individual studies were included. Among average-risk patients, the overall risk of VTE was estimated to be 13 per 1,000 person-years (95% CI, 7 to 23), with the highest risk among patients with cancers of the pancreas, brain, and lung. Among patients judged to be at high risk (due to metastatic disease or receipt of high-risk treatments), the risk of VTE was 68 per 1,000 person-years (95% CI, 48 to 96), with the highest risk among patients with brain cancer (200 per 1,000 person-years; 95% CI, 162 to 247). Our results need to be considered in light of high levels of heterogeneity, which exist due to differences in study population, outcome definition, and average duration of follow-up between studies.
Conclusions: VTE occurs in greater than 1% of cancer patients each year, but this varies widely by cancer type and time since diagnosis. The absolute VTE risks obtained from this review can aid in clinical decision-making about which people with cancer should receive anticoagulant prophylaxis and at what times.
Conflict of interest statement
The authors have declared that no competing interests exist.
Figures
References
-
- Heit JA, Cohen AT, Anderson FA Jr (2005) on behalf of the VTE Impact Assessment Group (2005) Estimated annual number of incident and recurrent, non-fatal and fatal venous thromboembolism (VTE) events in the US. ASH Annual Meeting Abstracts 106: 910.
-
- Heit JA, O'Fallon WM, Petterson TM, Lohse CM, Silverstein MD, et al. (2002) Relative impact of risk factors for deep vein thrombosis and pulmonary embolism: a population-based study. Arch Intern Med 162: 1245–1248. - PubMed
-
- Sorensen HT, Mellemkjaer L, Olsen JH, Baron JA (2000) Prognosis of cancers associated with venous thromboembolism. N Engl J Med 343: 1846–1850. - PubMed
-
- Vincent GK, Velkoff VA (2010) The next four decades—the older population in the United States: 2010 to 2050. Population estimates and projections. Washington (District of Columbia): US Census Bureau.
Publication types
MeSH terms
Grants and funding
LinkOut - more resources
Full Text Sources
Other Literature Sources
Medical
